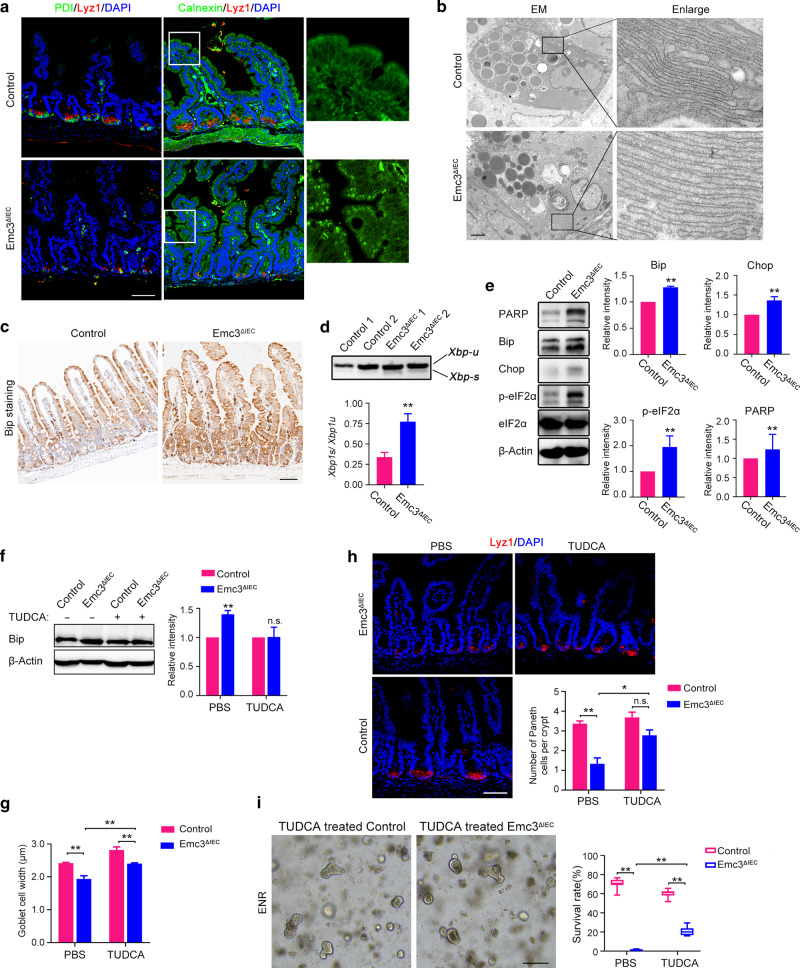
Fig. 5. Elevated ER stress and UPR activation caused by Emc3 deficiency disrupts secretory cells.
a Representative co-immunofluorescent images for Paneth cell marker (Lyz1) and ER markers (PDI or Calnexin) on ileal sections. Enlarged images of Calnexin in the villus are shown. Scale bar, 50 μm. b Representative TEM images of ER in Paneth cells. Note distend ER after Emc3 depletion. Scale bar, 2 μm. c Immunohistochemistry analysis for Bip. Scale bar, 50 μm. d Representative PCR results for Xbp1 splicing in control and mutant crypts. Xbp1-u, unspliced form; Xbp1-s, spliced form. The upper panel shows two independent mice for each genotype. Lower panel: n = 3 for each genotype. e Immunoblotting with indicated UPR mediators. β-Actin was used as a loading control. eIF2α was used as a loading control for phospo-eIF2α. n = 3 for each genotype. f Protein lysate from TUDCA-treated control and mutant crypts immunoblotted with Bip antibody. β-Actin was used as a loading control. n = 3 for each group. g The average width of the goblet cells after TUDCA treatment. n = 3 for each group. h Immunostaining and quantification of Paneth cells after TUDCA treatment. n = 3 for each group. Scale bar, 50 μm. i Representative and graphs for organoids generated from TUDCA or PBS administrated mice cultured for 3 days. n = 3 for each group. Scale bar, 200 μm. Data are shown as mean ± SEM (d–h) and box-and-whisker plots (i). Student’s t-test (d–f) and One-way ANOVA (g–i): **p < 0.01, *p < 0.05, n.s. not significant.

