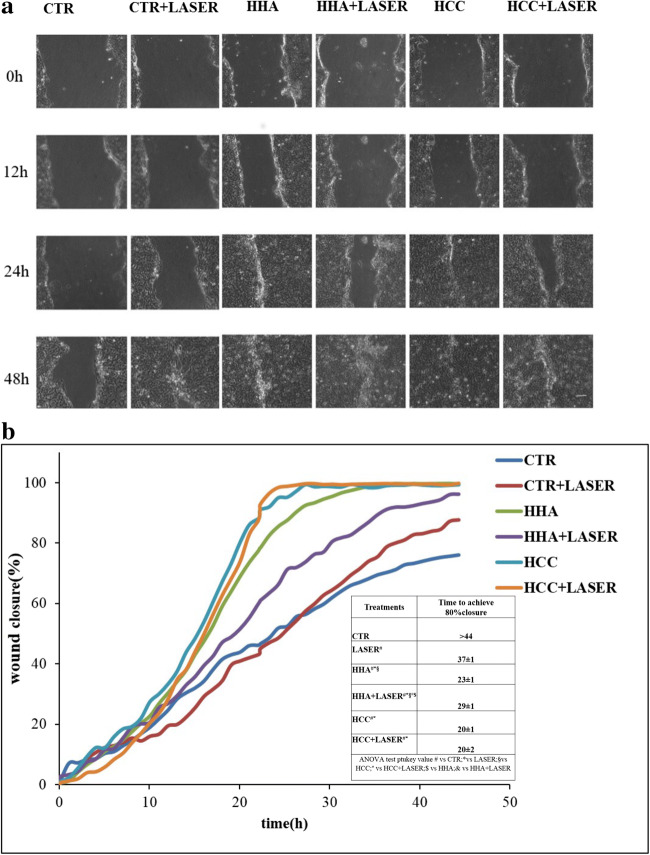
Fig. 2.
Wound healing assay. a Representative images of HaCaT wound healing in the CTR and in presence of treatments. b Reparation area percentage [Areat0 − Areat/Areat0 × 100] for the control and in presence of the treatments. The curves are averages of three different experiments with standard deviation within 5% of the value. Results were considered significantly different for ptukey < 0.05 # vs CTR, * vs CTR + LASER, § vs HCC, ° vs HCC + LASER, $ vs HHA, & vs HHA + LASER for each of the 5 families compared (tables in supplementary files)

