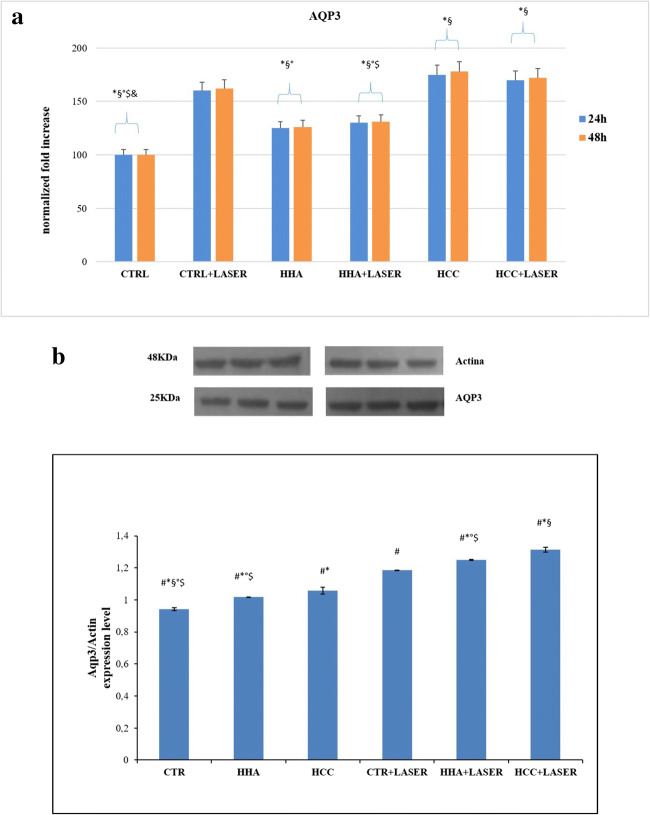
Fig. 4.
Real-time PCR and western blot analysis. a Relative AQP3 gene expression from HaCaT irradiated with laser and after treatment with HCC and HHA. *p < 0.01 for CTR + LASER, HCC, HCC + LASER vs CTR; #p < 0.05 for HHA and HHA + LASER vs CTR; #p < 0.05 for HCC and HCC + LASER vs CTR + LASER; a slight but significant difference was also found for HCC + LASER vs HHA + LASER. b AQP3 protein expression level and densitometric results were normalized in respect to actin. All values were expressed in the form of mean ± SD (n = 3). Results were considered significantly different for ptukey < 0.05 # vs CTR, * vs CTR + LASER, § vs HCC, ° vs HCC + LASER, $ vs HHA, & vs HHA + LASER for each of the 6 families compared (tables in supplementary files)

