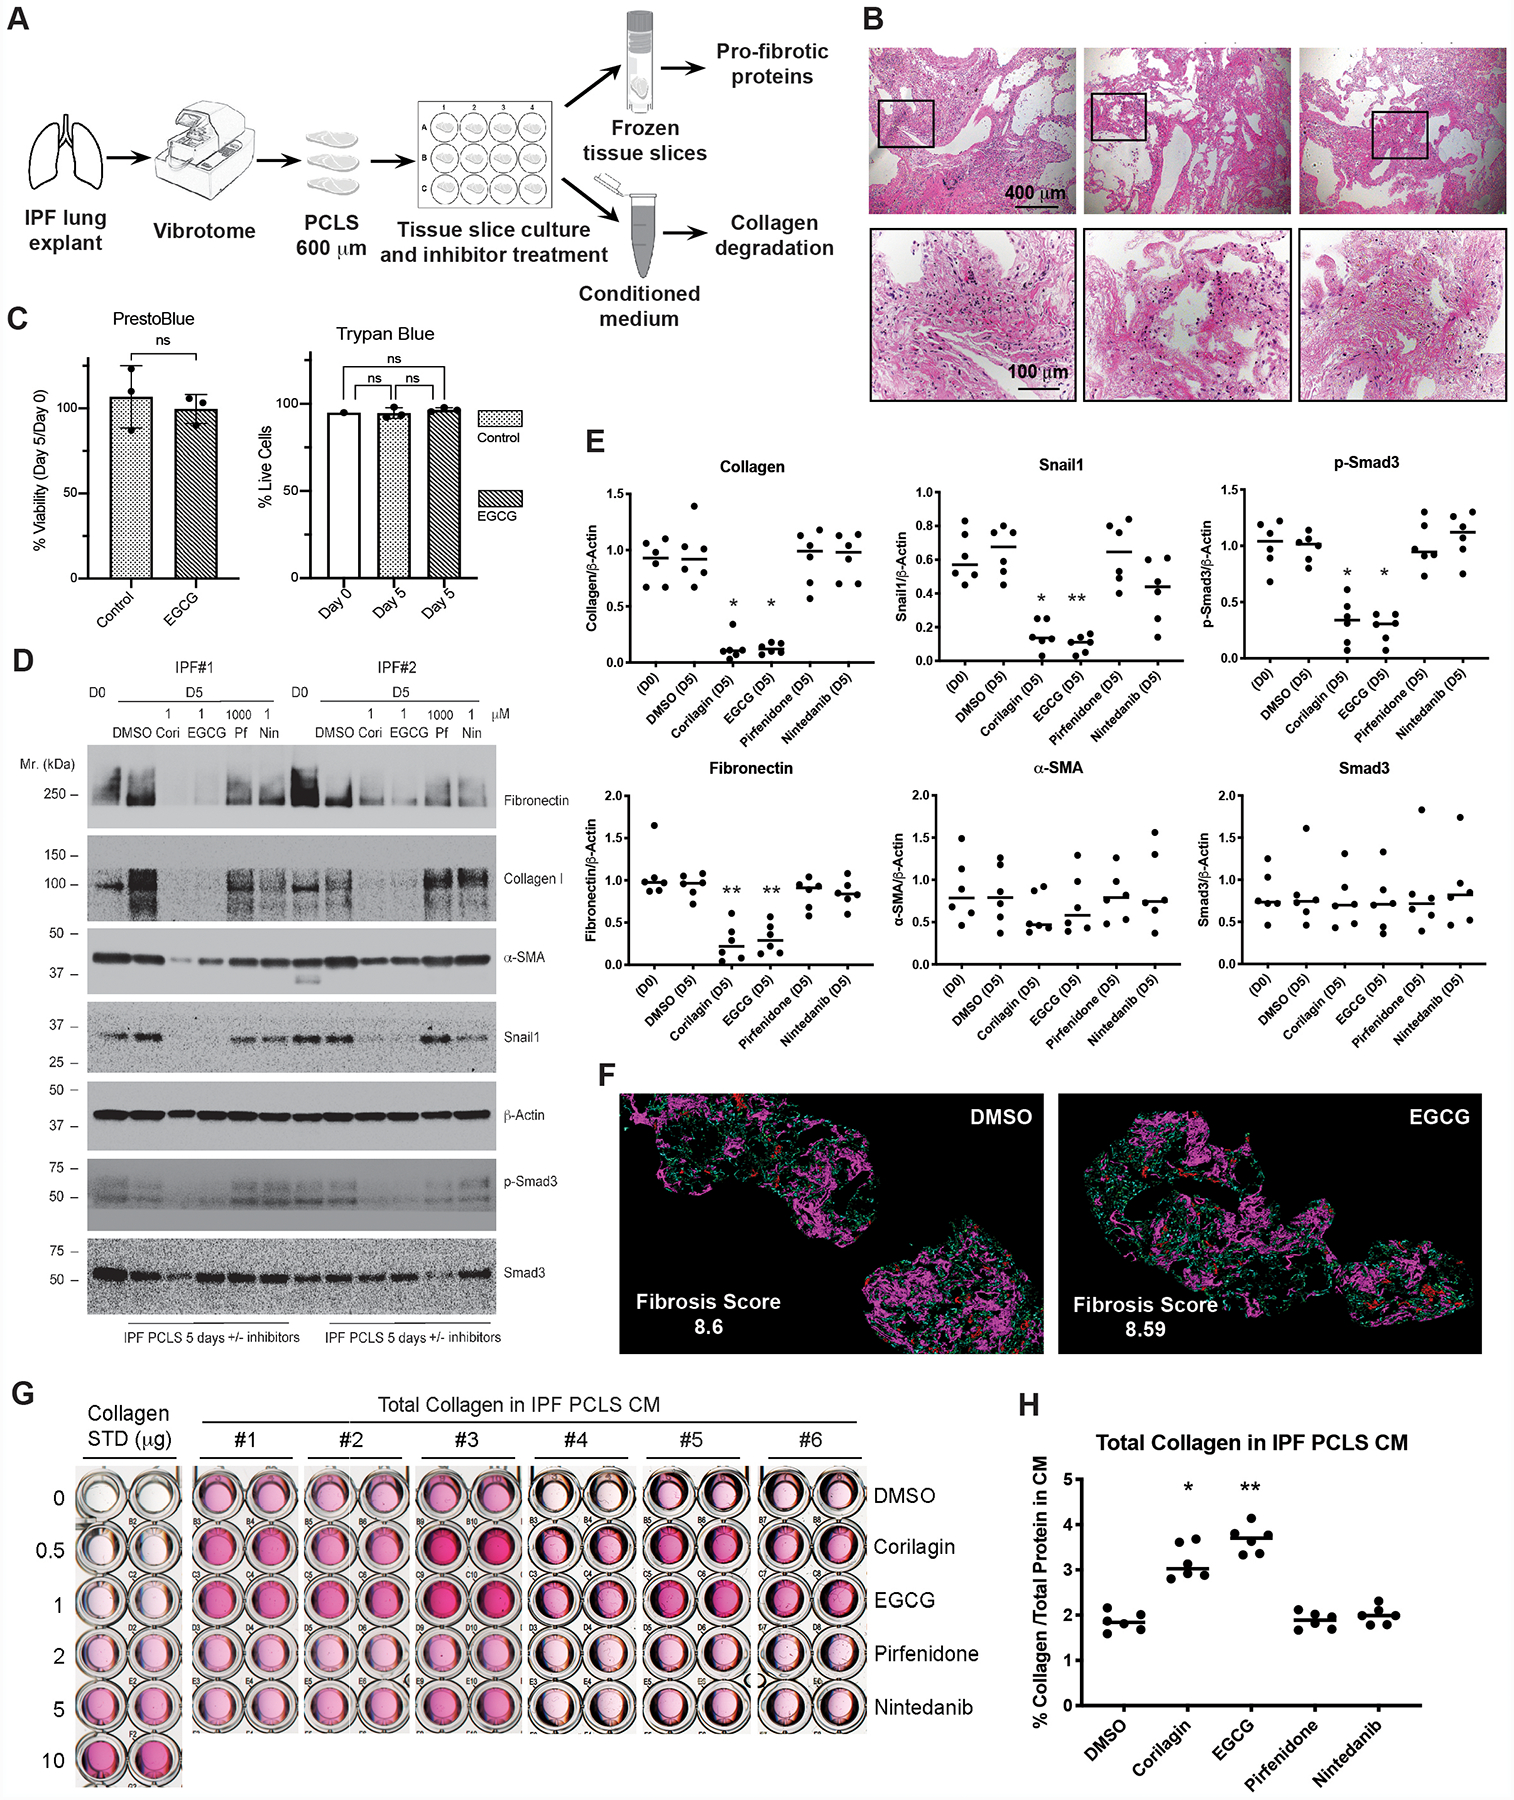
Figure 1.

Profibrotic markers are decreased in IPF PCLS tissue while total soluble collagen in IPF PCLS conditioned medium (CM) is increased by the treatment of EGCG or corilagin, but not pirfenidone or nintedanib. (A) IPF lung slicing process and experimental setup are illustrated. (B) Hematoxylin and eosin (H&E) staining of PCLS prepared from a representative IPF donor lung and PCLS cultured with EGCG or vehicle treatment for 5 days. Scale bars: 400 μm for upper panels and 100 μm for lower panels, which show higher-magnification images for the boxed areas in upper panels. (C) PCLS metabolic activity was assessed at D0 and D5 using PrestoBlue Cell Viability Reagents both in EGCG-treated and control PCLSs. Live/Dead cell counts were assessed using Trypan Blue staining. Percent Viability: (D5 fluorescence/D0 fluorescence) X100, unpaired two-tailed t-test; Percent Live Cells: (total cells-trypan blue+ cells)/total cells X100, one-way ANOVA with post hoc Tukey test. n=3, ns: not significant. (D) PCLS lysates equalized based on total protein from Day 0 or Day 5 culture with or without inhibitors (Cori-corilagin, EGCG, Pf-pirfenidone, Nin-nintedanib) were blotted for Fibronectin, Collagen I, α-Smooth Muscle Actin (α-SMA), Snail1, β-actin, p-Smad3, and total Smad3. Data from two representative IPF patients were shown. (E) Densitometry of Western blot bands was measured using NIH ImageJ software. Density of each band normalized to β-actin from D0 and D5 cultured IPF PCLS were quantified. Differences in protein levels across the groups were tested for significance with Kruskal-Wallis distribution. Comparisons between each treated group and DMSO control group were calculated by Wilcoxon rank-sum test. Normalized band intensity is expressed as mean ± SD. N=6. *P < 0.05, **P < 0.01, no label: not significant. (F) Ten-μm paraffin-embedded tissue sections from 5-day cultured IPF PCLS treated with vehicle DMSO or EGCG were imaged using SHG microscopy (n=2 per group). Magenta/Red: larger cross-linked collagens; Blue/Green: fine cross-linked collagens. Scale bars: 400 μm. Overall fibrosis score averages are indicated in the figure. (G) Total collagen from IPF PCLS 5-day CM with or without indicated inhibitors was concentrated and measured by Sircol assay. STD, standard. (H) Calculated total collagen concentration (μg/ml) in IPF PCLS CM was normalized to total protein concentration in CM and converted to percentage of total protein in CM (mean ± SD, N=6). Differences in collagen levels across the groups were tested for significance with Kruskal-Wallis distribution. Comparisons between each treated group and DMSO control group were calculated by Wilcoxon rank-sum test. *P < 0.05, **P < 0.01, no label: not significant.
