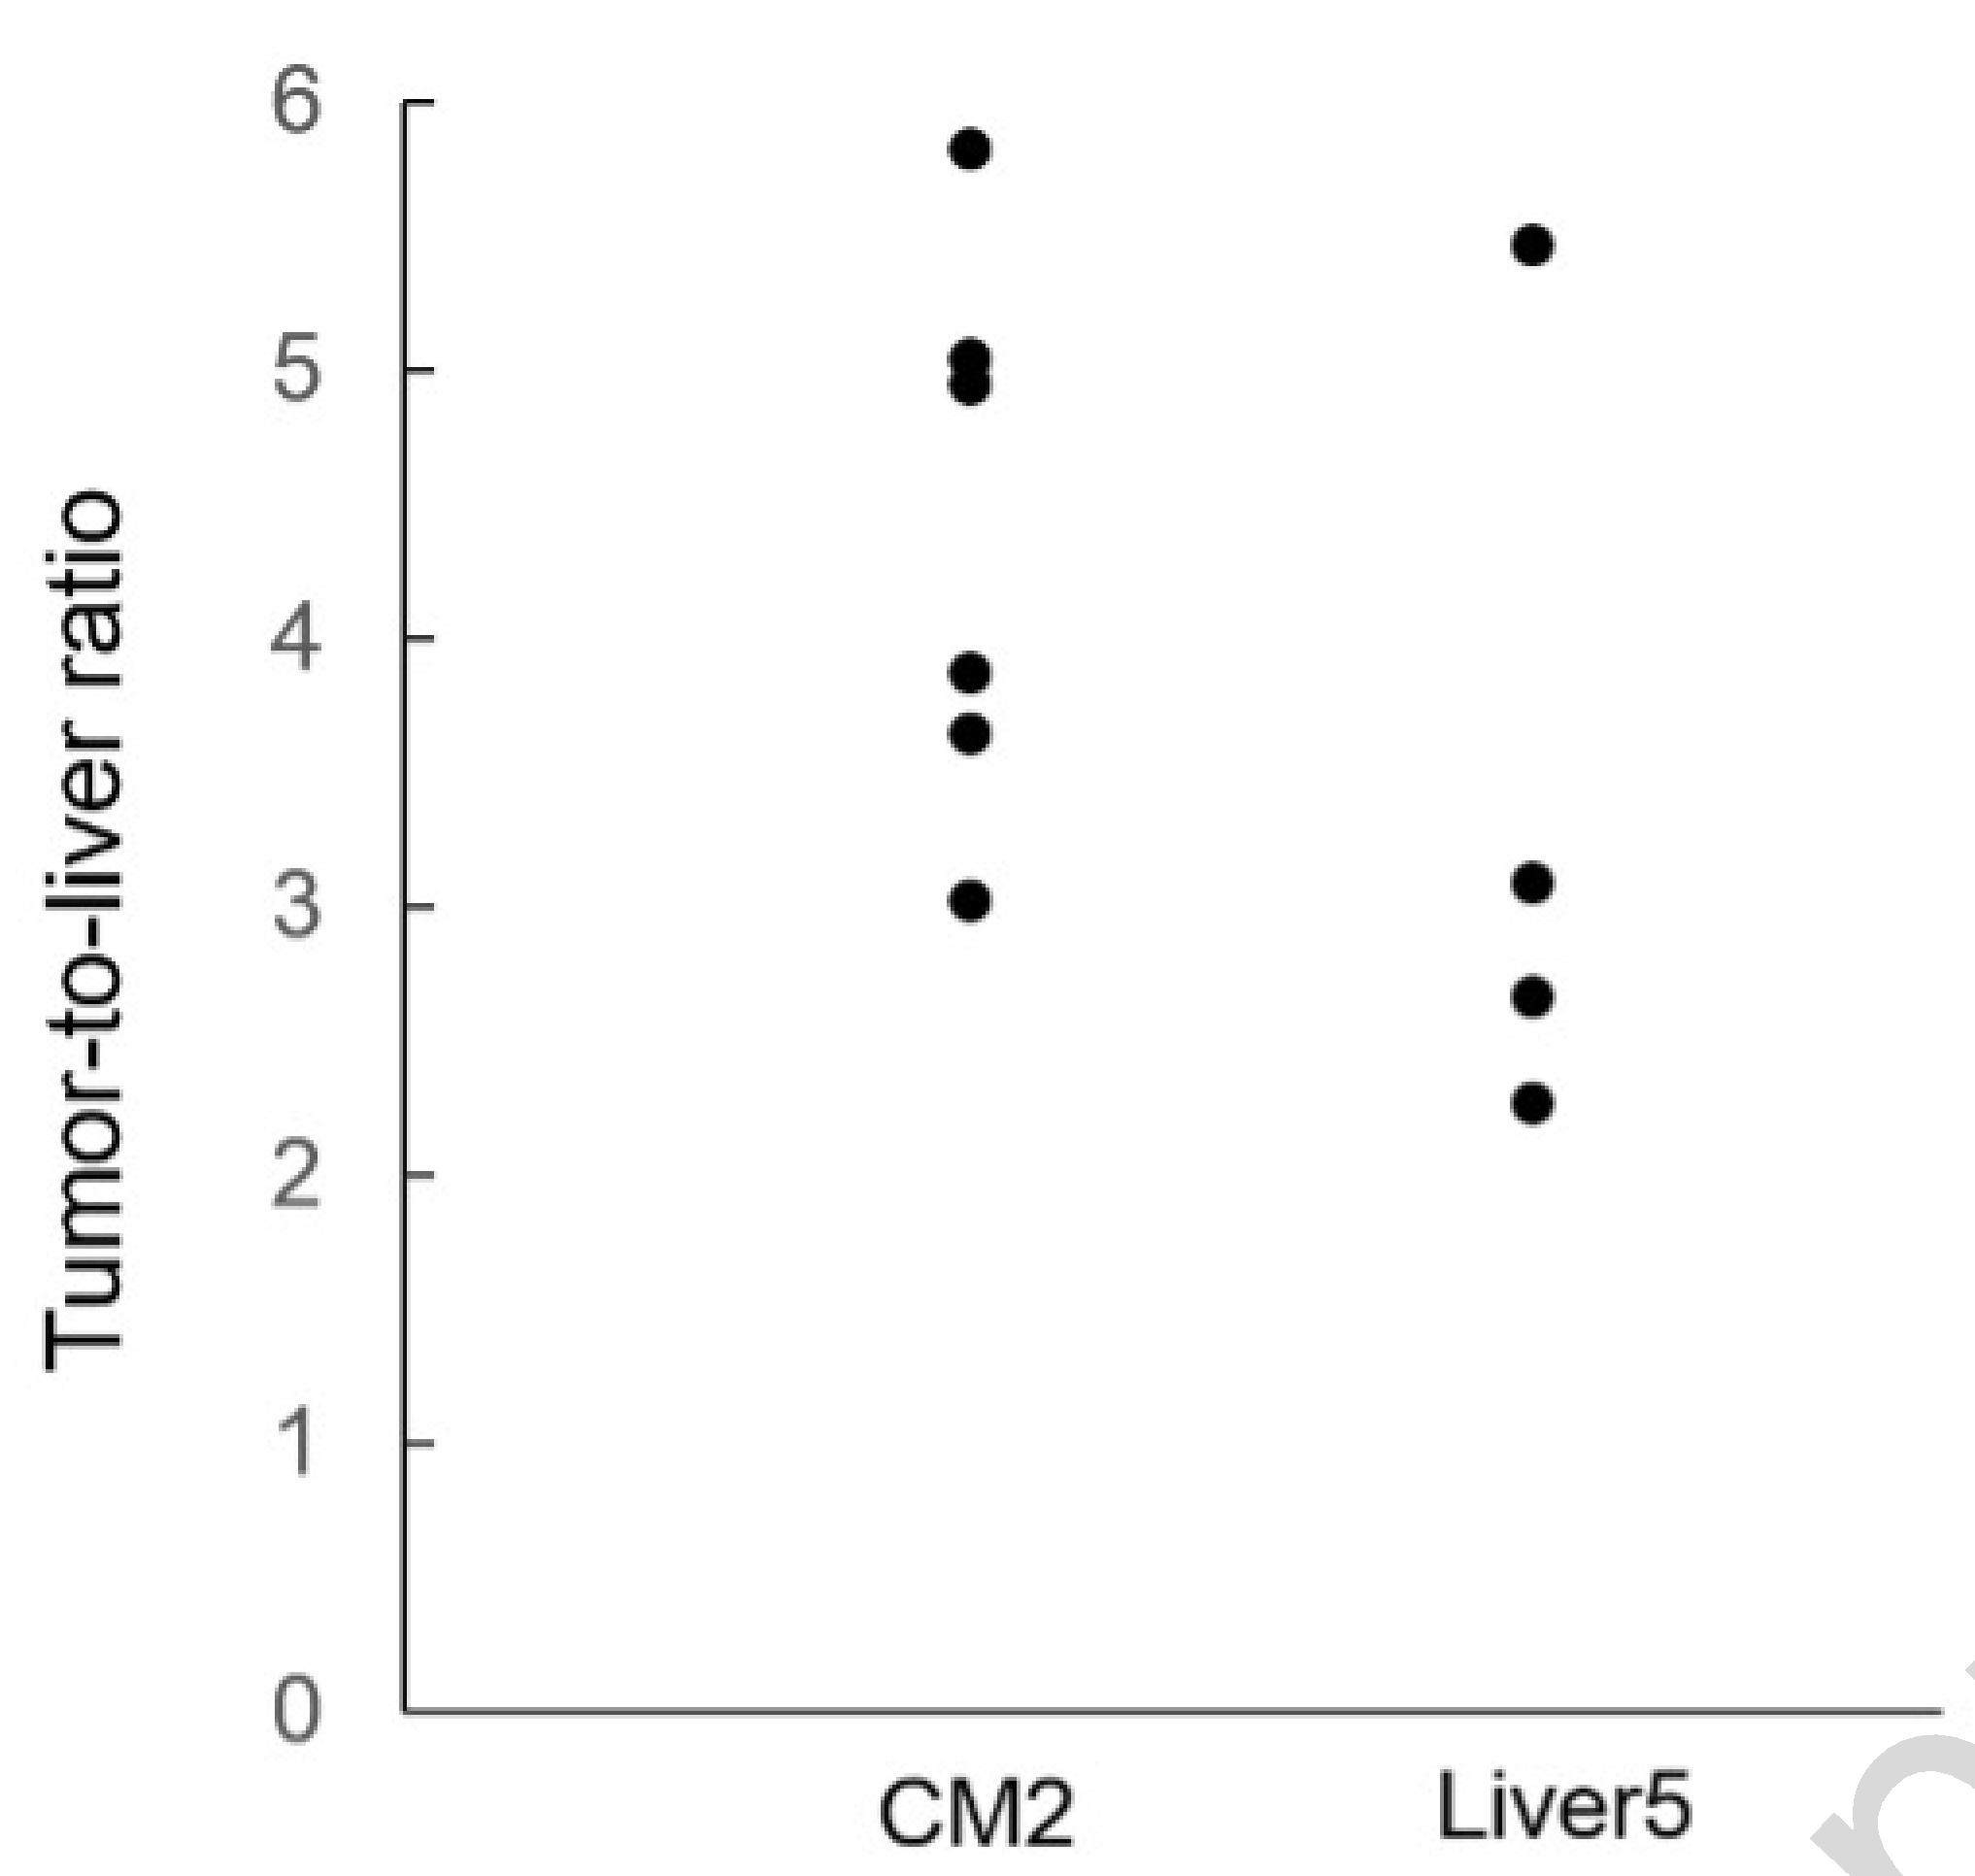
Figure 3.

The dot chart of tumor-to-liver ratio (TLR). TLR was calculated for each mouse by dividing maximum tumor fluorescence by maximum liver fluorescence. In CM2 cohort, the mean TLR was 4.40 ± 0.96. In Liver5 cohort, the mean TLR for the entire cohort of mice was 3.38 ± 1.25.
