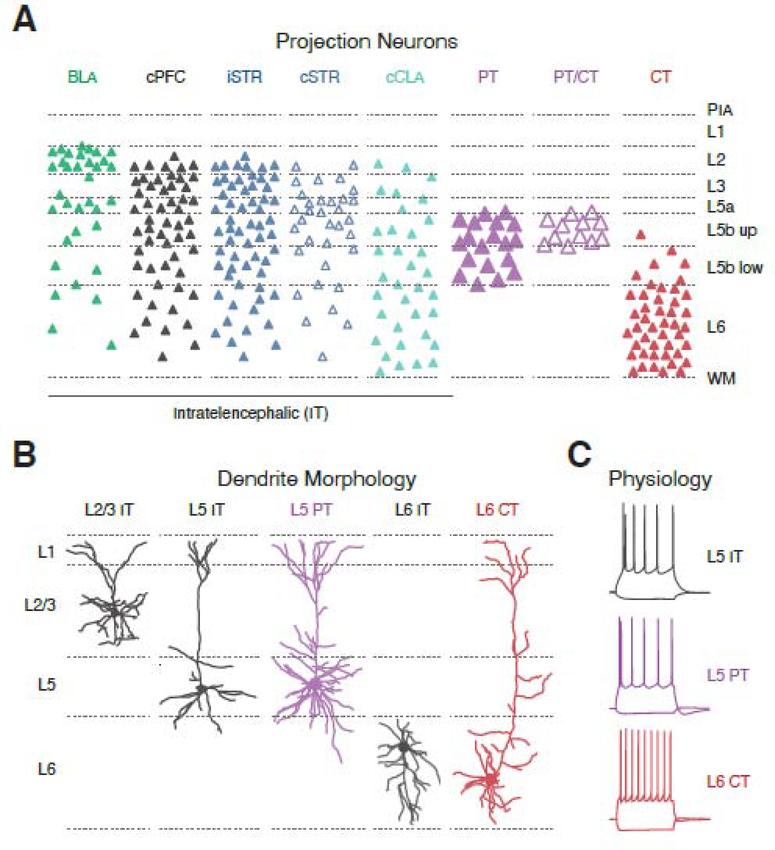
Figure 2. mPFC projection neuron diversity.
A) Laminar distributions of projection neurons in the mPFC, identified by injection of retrograde tracers into target brain regions. BLA = basolateral amygdala, cPFC = contralateral PFC, iSTR = ipsilateral striatum, cSTR = contralateral striatum, cCLA = contralateral claustrum, PT = pyramidal tract, PT / CT = PT cells that send collaterals to the thalamus, CT = corticothalamic, non-PT cells. PIA = pial surface, WM = white matter, L5b up = upper L5b, L5b low = lower L5b. Note that projection neurons are found from L2 to L6.
B) Dendritic morphologies of mPFC projection neurons. From left to right: L2/3 intratelencephalic (IT) cell, L5 IT cell, L5 pyramidal tract (PT) cell, L6 IT cell, and L6 corticothalamic (CT) cell. Note that L5 PT cells have more elaborate dendrites than adjacent IT cells, and that L6 CT cells have apical dendrites that often extend to L1, unlike L6 IT cells that can display inverted pyramidal morphologies.
C) Intrinsic firing properties of mPFC projection neurons. From top to bottom: L5 IT cells, L5 PT cells and L6 CT cells. Note that L5 IT cells lack Ih-mediated voltage sag, L5 PT cells display strong Ih-mediated voltage sag, and L6 CT cells display highly non-adapting firing patterns.
Panel A adapted from references 16 & 32. Data in panels B & C used with permission from references 16, 32 & 42,

