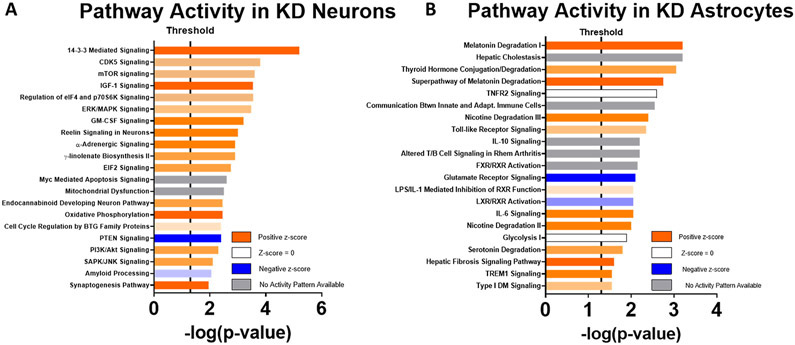
Figure 6. IPA.
Orange bars indicate upregulation of KD samples versus chow samples, and blue bars indicate downregulation of KD samples versus chow samples. Degree of saturation of color bars indicates relative strength of prediction scores. White bars indicate no predicted activation or inactivation. Grey bars indicate pathways where not enough information exists to predict activation status. A) For neurons (n = 7, 7). B) For astrocytes (n = 7, 6).

