
Figure 3: Event Study Estimates for Per Capita Opioid Supply.
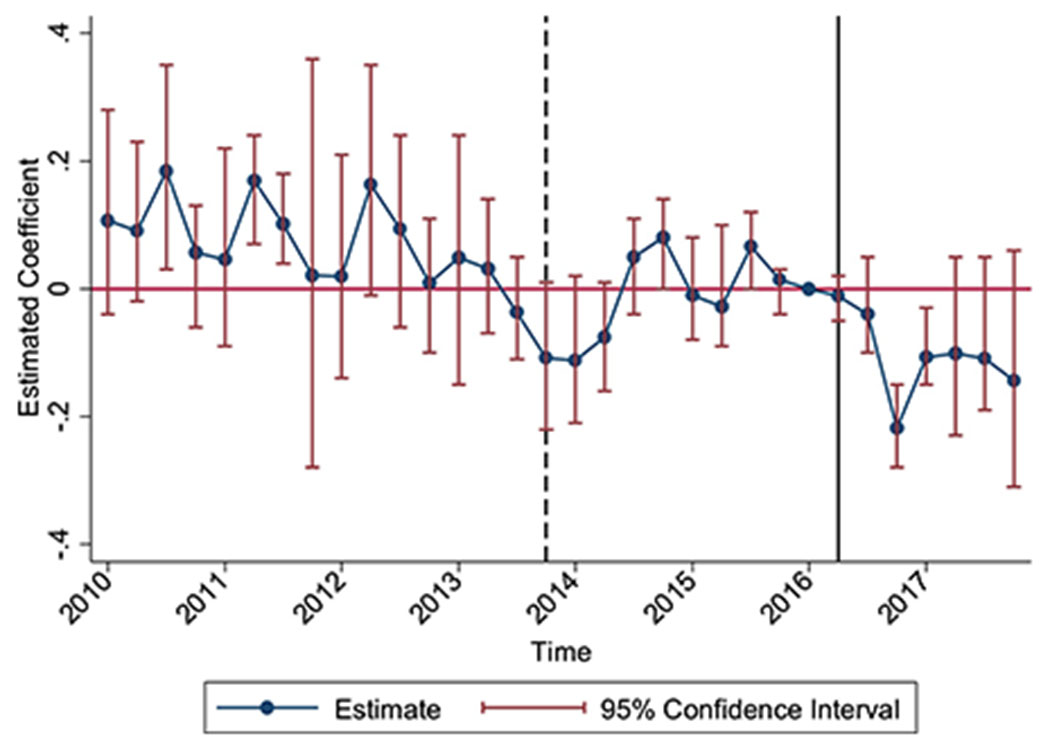
Notes: N=416. 95% confidence intervals estimated using Ferman and Pinto (2019) which accounts for within-unit clustering and heteroskedasticity given only one treated unit. Outcome is the number of morphine equivalent doses supplied to the state divided by the population size. The dotted vertical line signifies New York’s adoption of a “must access” PDMP. The solid vertical line represents the adoption of New York’s e-prescribing mandate. The estimated specification includes state and calendar quarter fixed effects as well as the following variables interacted with quarter indicators: share white, log of 2009 population, share with a college degree, share ages 25-44. We also condition on the following state policy variables: any PDMP, “must access” PDMP, pain clinic regulations, medical marijuana law, legal and operational medical marijuana dispensaries, and prescribing limits. Regression is weighted by population. The estimates reported in the figure are the coefficients on the New York indicator interacted with quarter indicators and are normalized to 0 in 2016q1.