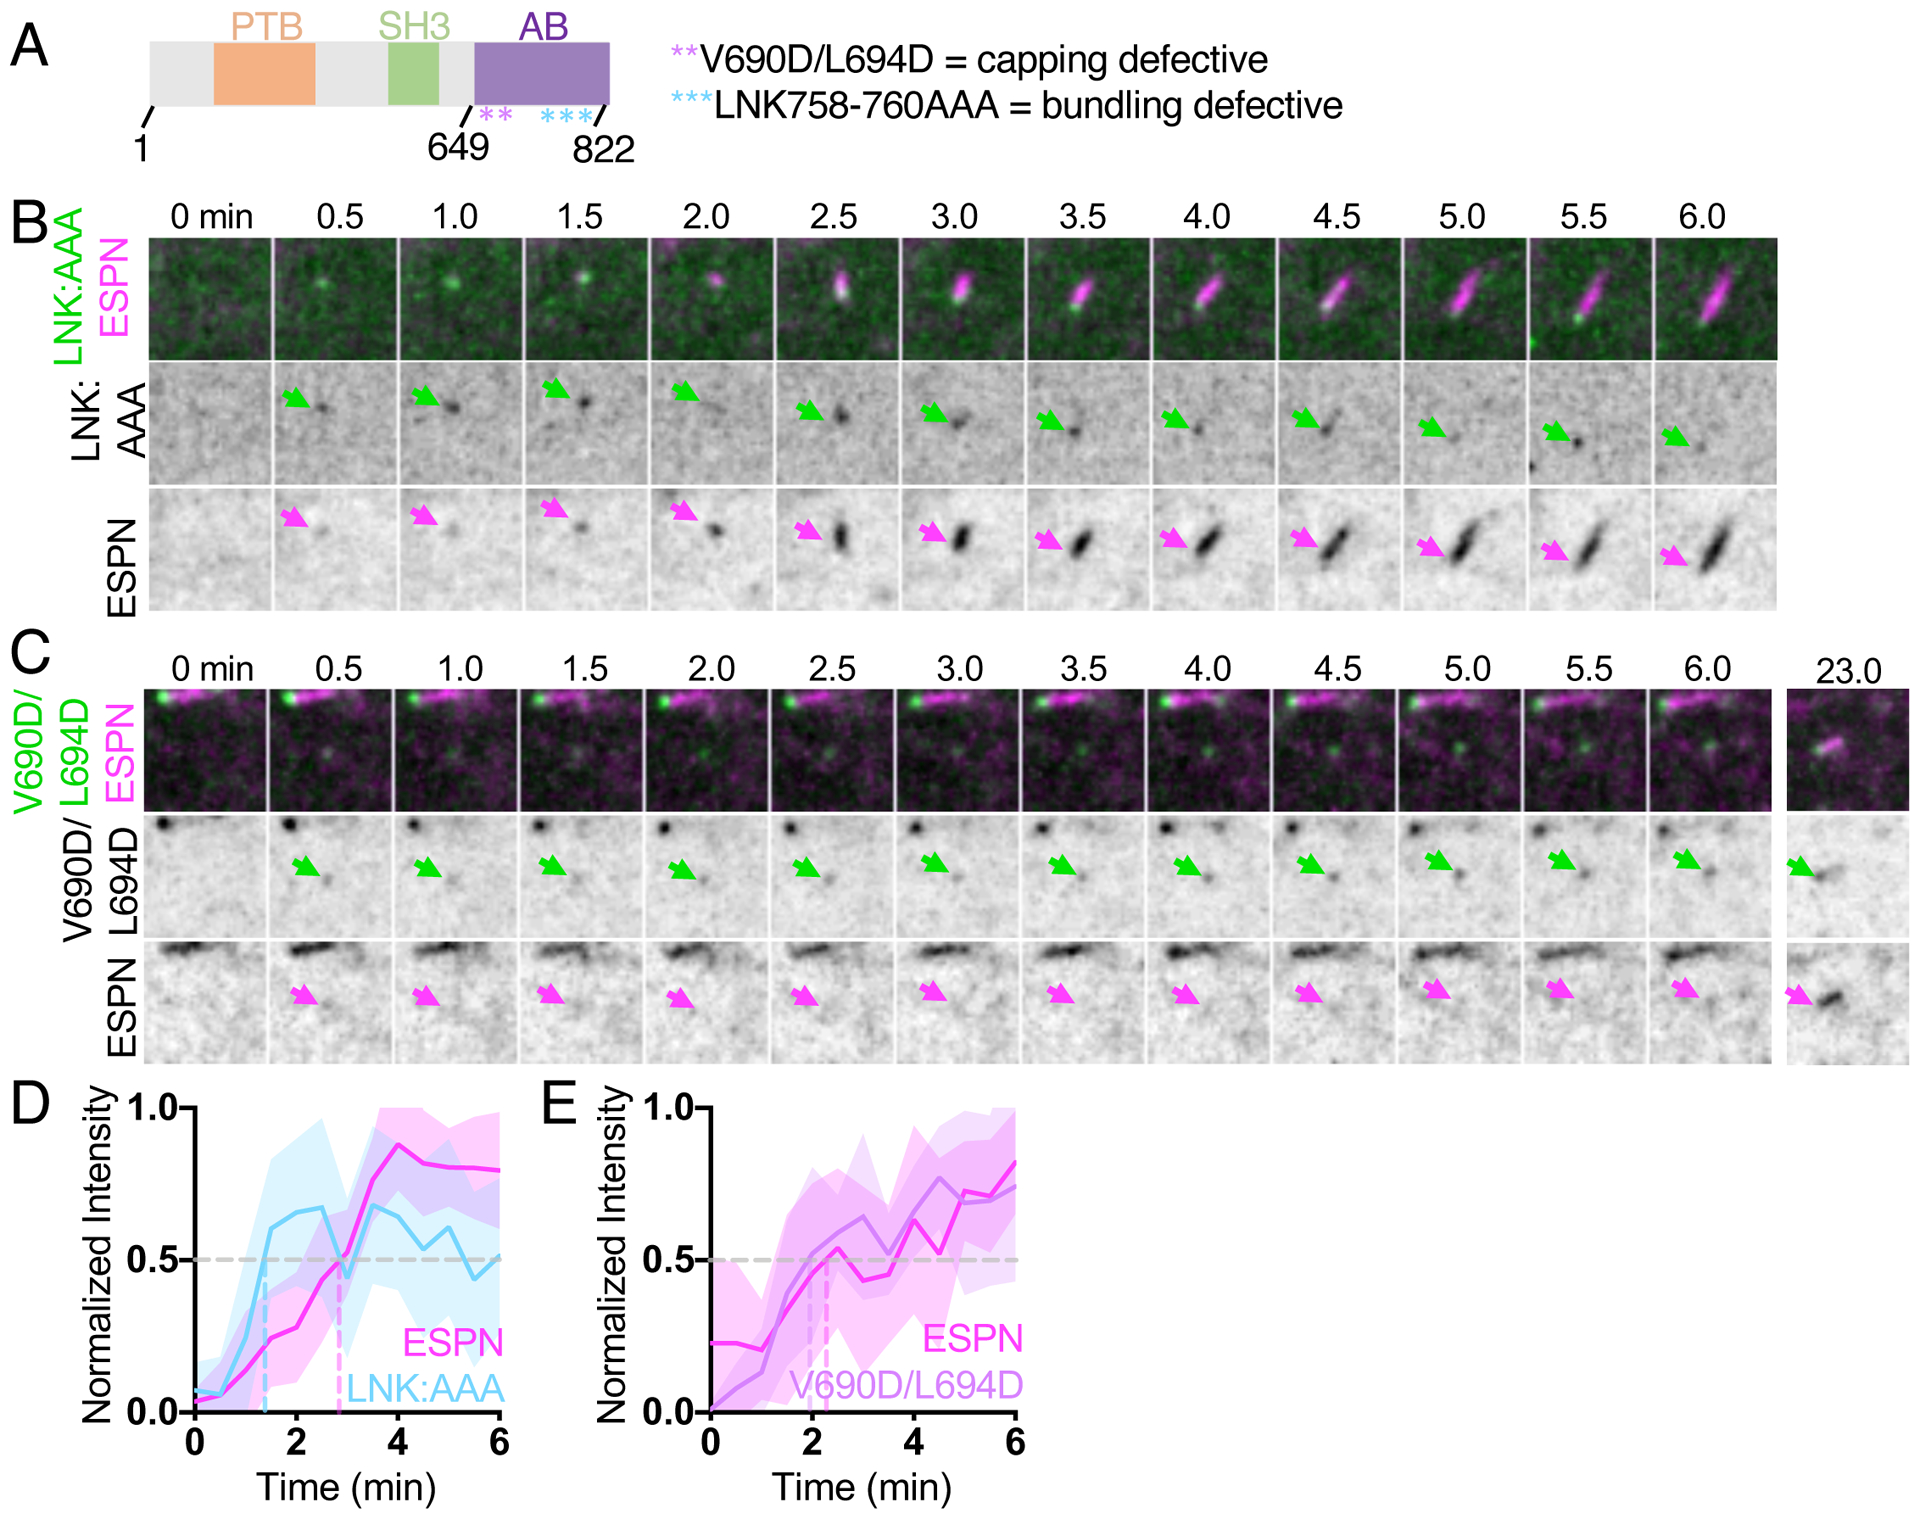
Figure 2. EPS8 actin binding mutants disrupt EPS8 puncta formation and core bundle growth.

(A) Domain diagram of human EPS8. PTB = phosphotyrosine binding domain, SH3 = src-homology 3 domain, AB = actin binding domain. Asterisks represent point mutations in the residues shown. (B) Montage of a de novo microvillus growth event in a CL4 cell expressing EGFP-EPS8 LNK758-760AAA (LNK:AAA) and mCherry-ESPN. Arrows denote the accumulation of EGFP-EPS8 LNK:AAA (green) or mCherry-ESPN (magenta). Box width = 4 μm. (C) Montage of a de novo microvillus growth event in cell expressing EGFP-EPS8 V690D/L694D and mCherry-ESPN. Arrows denote the accumulation of EGFP-EPS8 V690D/L694D (green) or mCherry-ESPN (magenta). Box width = 4 μm. (D) Normalized intensity vs. time curve for microvillus growth events in cells expressing EGFP-EPS8 LNK:AAA (light blue) and mCherry-ESPN (magenta); n = 11 events from 5 cells. (E) Normalized intensity vs. time curves for microvillus growth events in cells expressing EGFP-EPS8 V690D/L694D (lavender) and mCherry-ESPN (magenta); n = 9 events from 4 cells. For D and E, t = 0 is defined as −3 frames (1.5 min) before the appearance of the EGFP-EPS8 LNK:AAA or EGFP-EPS8 V690D L694D signal. All images shown are maximum intensity projections. For all normalized intensity vs. time curves, dashed lines indicate when curves cross a normalized intensity of 0.5. For all curves, the solid line represents the mean and shading represents SD. See also Figure S3.
