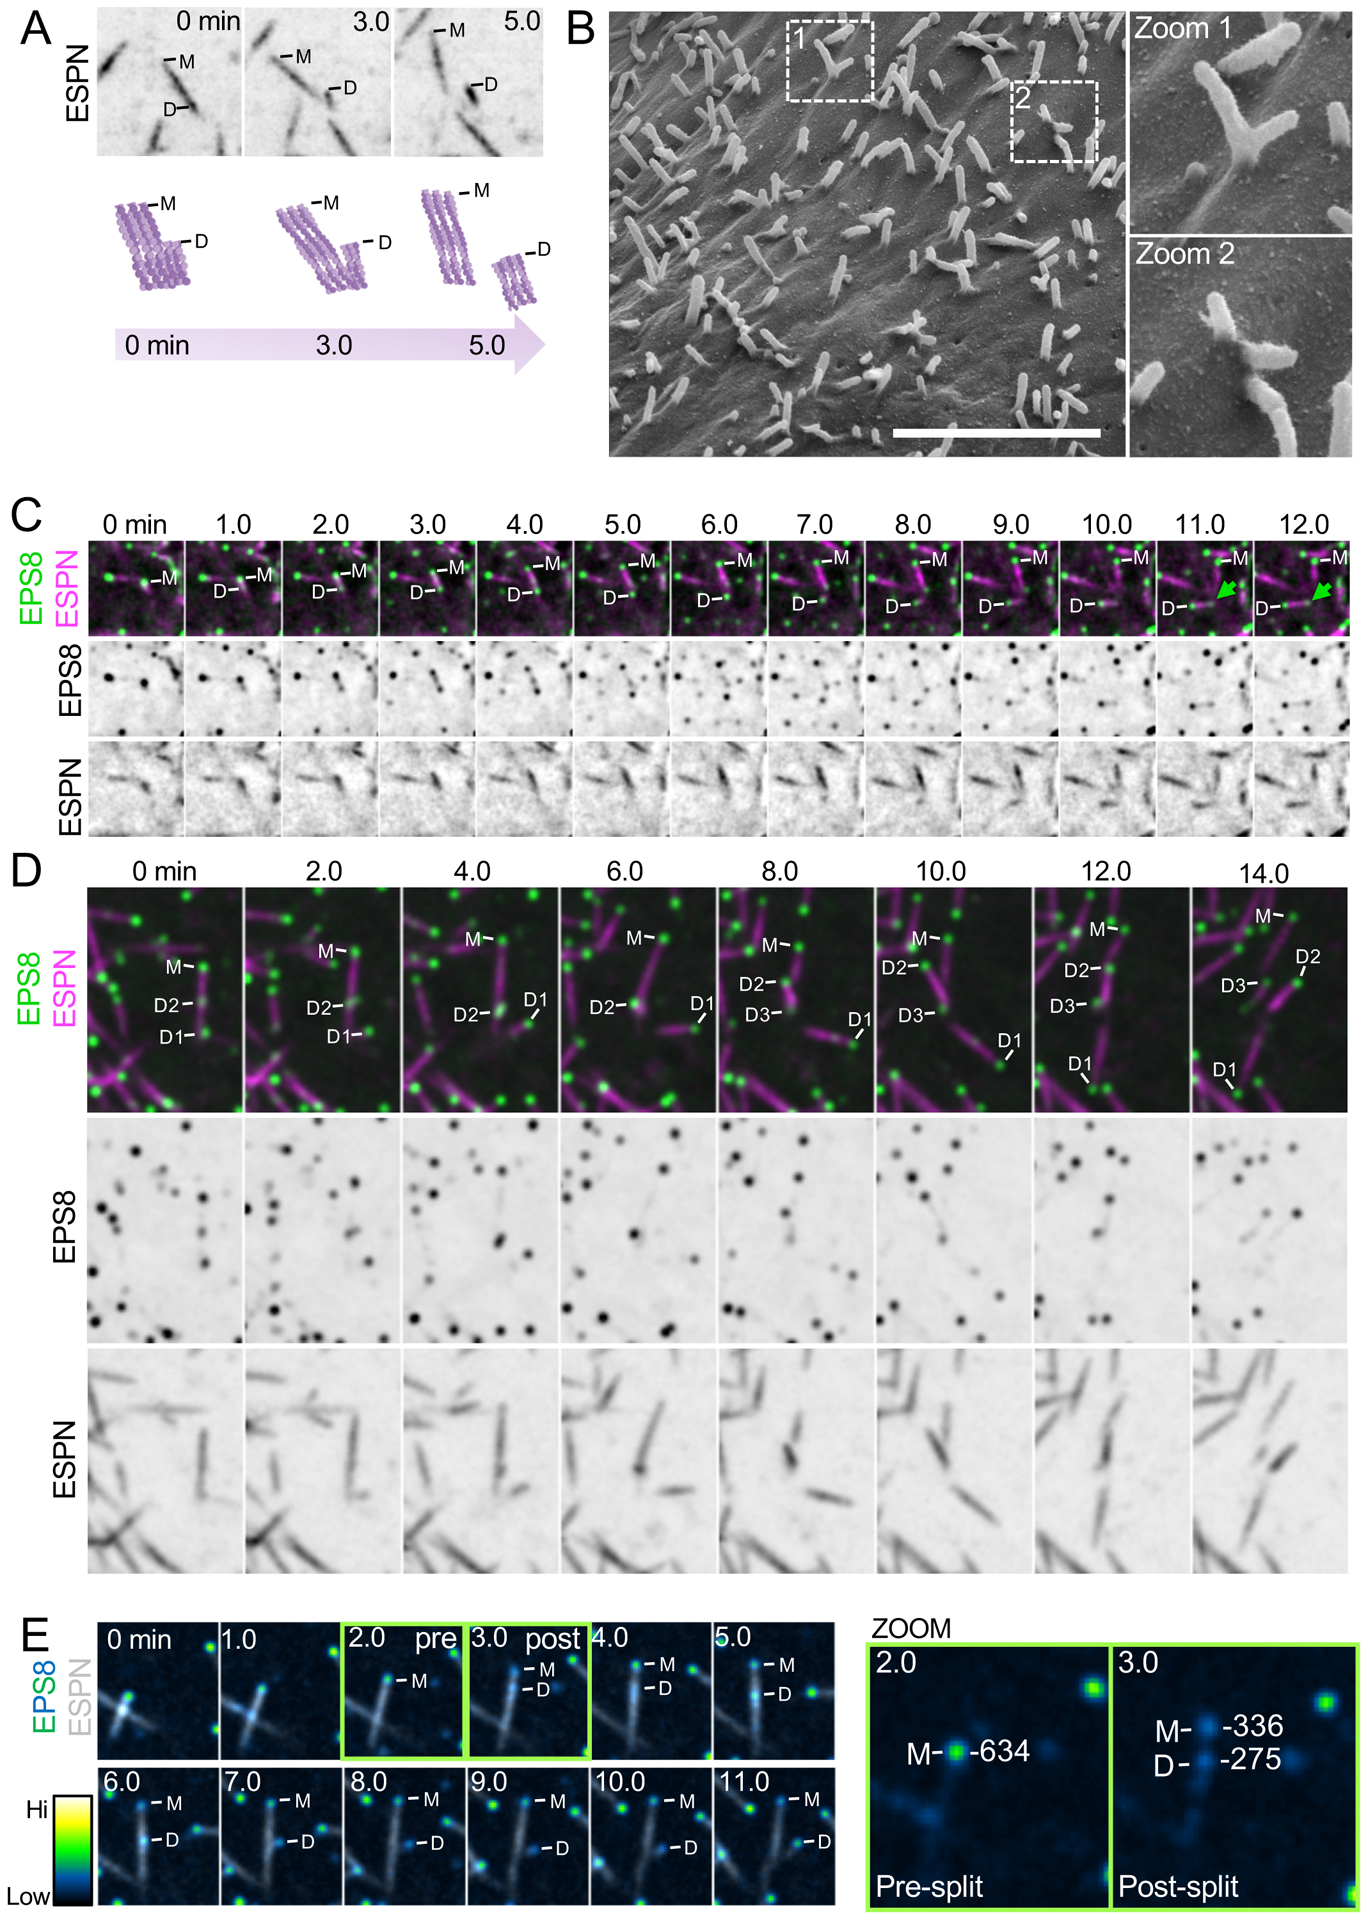
Figure 3. New microvilli can grow from pre-existing microvilli.

(A) Top, representative montage of a daughter microvillus growing from the base of an existing mother bundle in a CL4 cell expressing mCherry-ESPN. “M” denotes the mother microvillus and “D” denotes the growing daughter. Box width = 6 μm. Bottom, cartoon schematic of mother/daughter growth corresponding to montage above. Related to Figure S4 and Video S4. (B) SEM image of a CL4 cell expressing mCherry-ESPN at an early stage of differentiation. Zoom 1 highlights a branched mother/daughter structure whereas zoom 2 likely shows core bundles that may still be physically coupled beneath the plasma membrane. Scale bar = 4 μm. (C) Representative montage of a daughter microvillus growing from the base of an existing mother bundle in cells expressing EGFP-EPS8 and mCherry-Espin. “M” denotes EPS8 at the tip of the mother microvillus and “D” denotes EPS8 which will eventually mark the tip of a growing daughter microvillus. Green arrow highlights an EPS8 punctum forming at the base of the daughter bundle. Box width = 6 μm. (D) Representative montage of a mother microvillus in a CL4 cell expressing EGFP-EPS8 and mCherry-ESPN giving rise to multiple daughter microvilli from the base of the mother bundle. “M” denotes EPS8 at the tip of the mother microvillus and “D1–3” denote EPS8 puncta at the tips of growing daughters. Box width = 6.6 μm. (E) Montage of a daughter microvillus growth event (left) with EGFP-EPS8 pseudocolored by intensity. Green boxes highlight pre- and post-split frames. The corresponding quantification of EGFP-EPS8 integrated 16-bit intensity pre- and post-splitting of EPS8 tip punctum is highlighted in the zoom panels to the right. Note that the total post-split integrated intensity is nearly equal to the pre-split integrated intensity. Box width = 5.6 μm. All images shown are maximum intensity projections. See also Figure S4.
