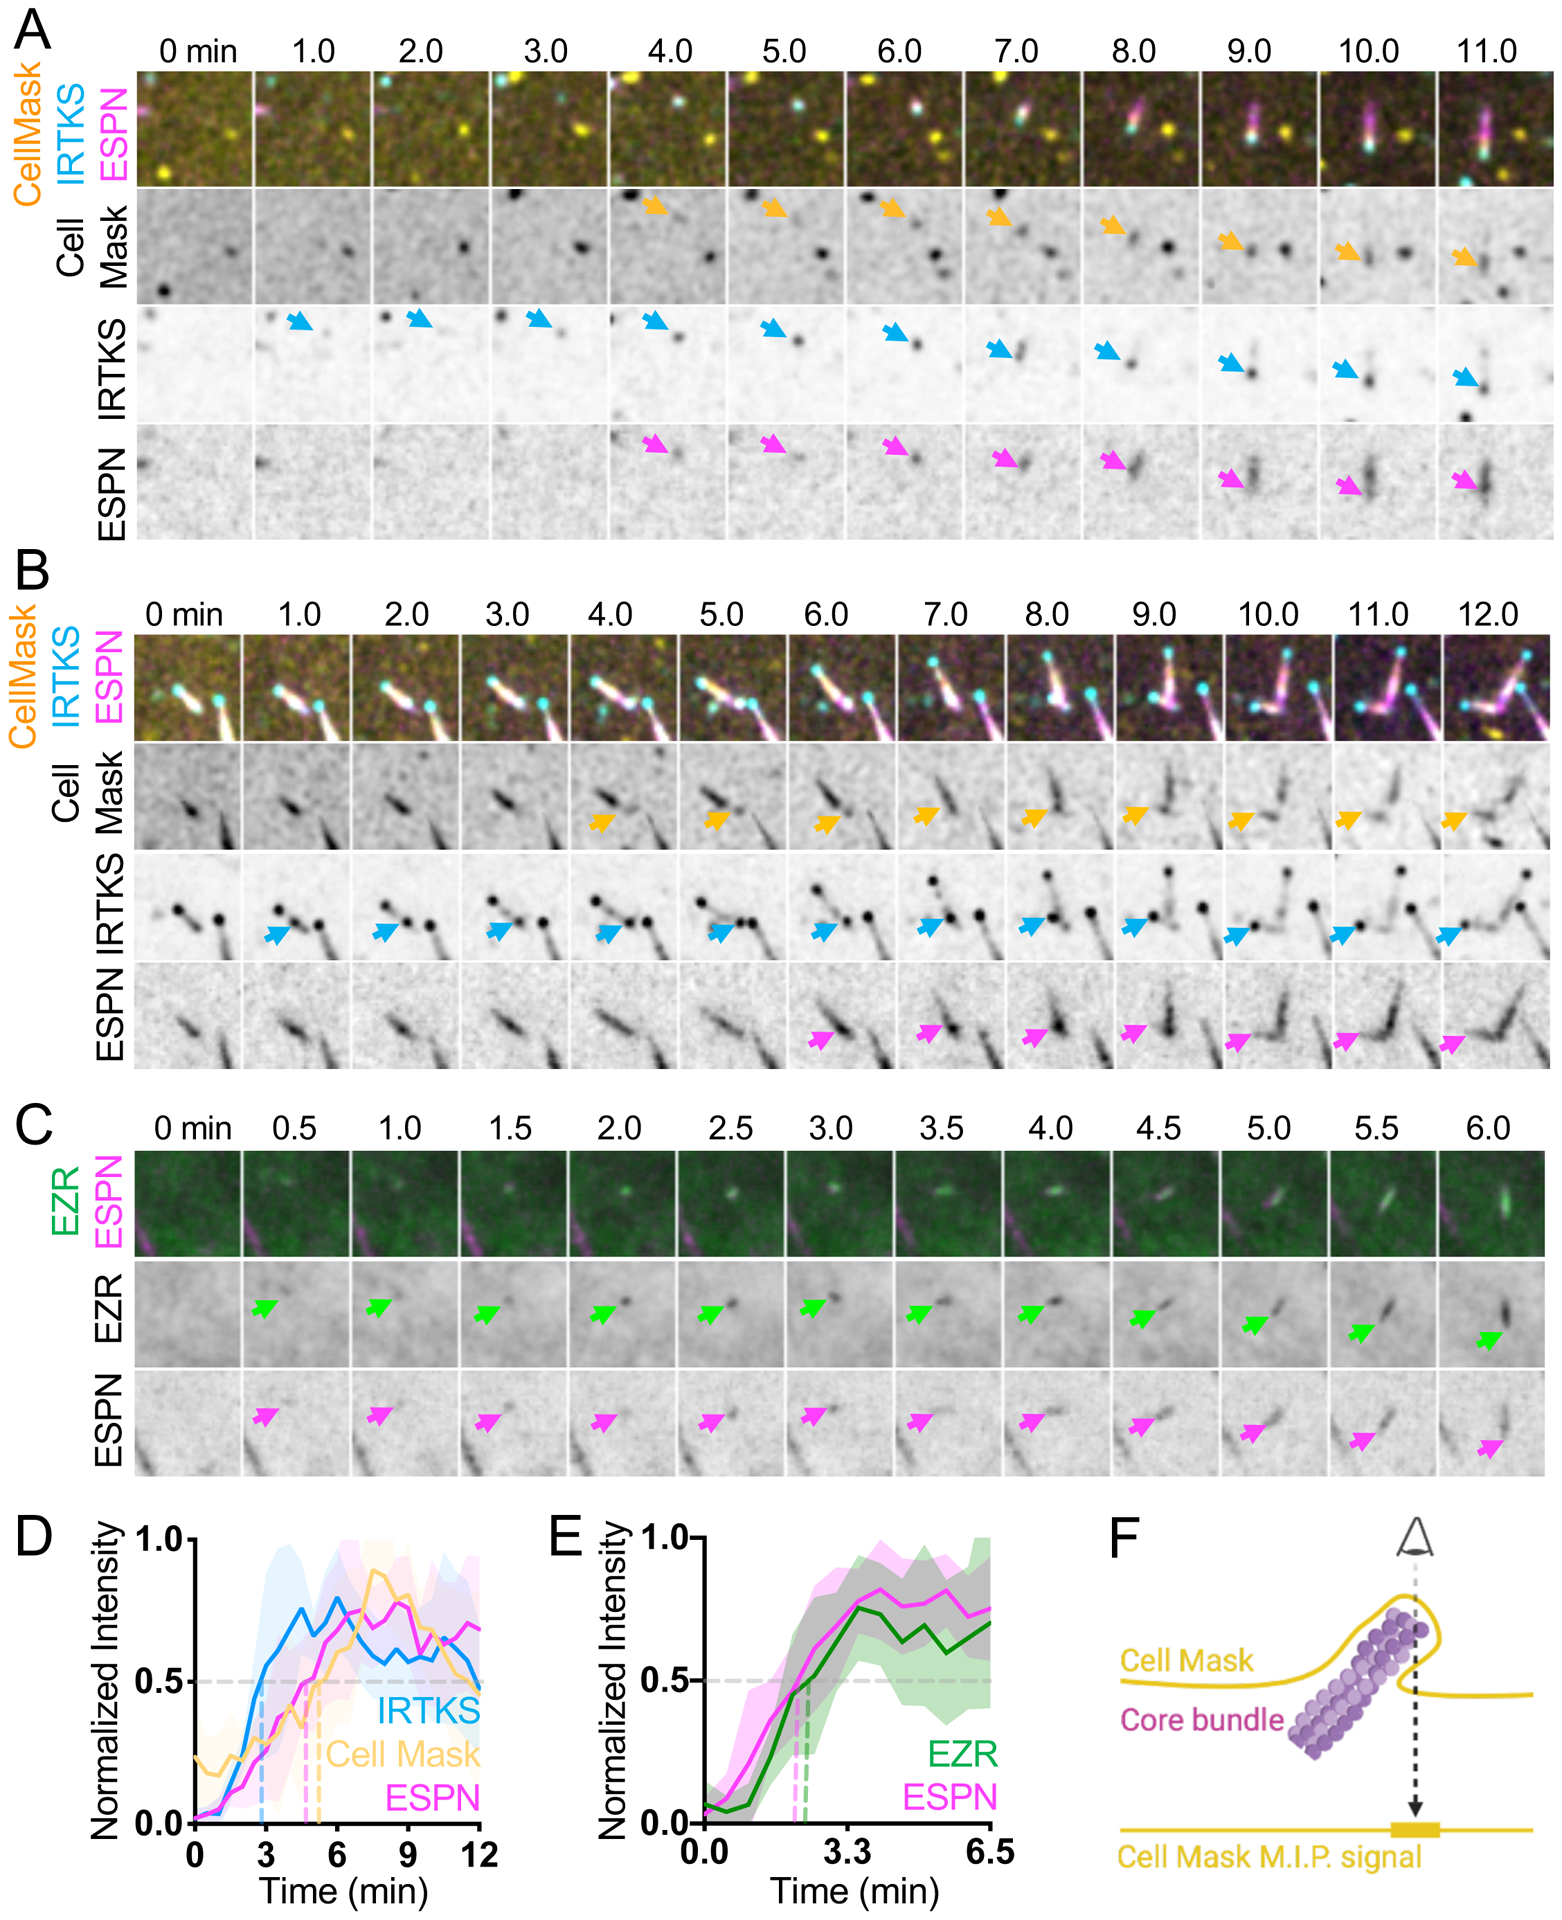
Figure 5. Membrane encapsulation occurs in parallel with core bundle formation.

(A) Montage of de novo microvillus growth event in a CL4 cell expressing EGFP-IRTKS and mCherry-ESPN and stained with CellMask-DeepRed to mark the plasma membrane. Arrows denote the onset of membrane wrapping visualized by CellMask-DeepRed (yellow), or the presence of EGFP-IRTKS (cyan) and mCherry-ESPN (magenta). Box width = 4 μm. (B) Representative montage of daughter microvillus formation in a cell expressing EGFP-IRTKS and mCherry-ESPN and stained with CellMask-DeepRed. Arrows denote the onset of membrane wrapping as visualized by CellMask-DeepRed (yellow), or the presence of EGFP-IRTKS (cyan) and mCherry-ESPN (magenta) of the daughter microvillus. Related to Video S6. (C) Montage of a de novo microvillus growth event in a CL4 cell expressing EZR-GFP and mCherry-ESPN. Arrows denote the presence of EZR-GFP (green) or mCherry-ESPN (magenta). Box width = 4 μm. Related to Video S7. (D) Normalized intensity curves of cells expressing EGFP-IRTKS and mCherry-ESPN and stained with CellMask-DeepRed corresponding to montage in A; n = 6 growth events from 3 cells. (E) Normalized intensity curves of cells expressing EZR-GFP and mCherry-ESPN corresponding to montage in C; n = 11 growth events from 8 cells. (F) Schematic representation of a microvillus stained with cell mask and the resulting maximum intensity projected signal. All images shown are maximum intensity projections. Dashed lines for normalized intensity curves indicate point at which curves cross a normalized intensity of 0.5. For all curves, the solid line represents the mean and shading represents SD. For D and E, t = 0 is defined as −3 frames (1.5 min) before the appearance of the EGFP-IRTKS or EZR-EGFP signal.
