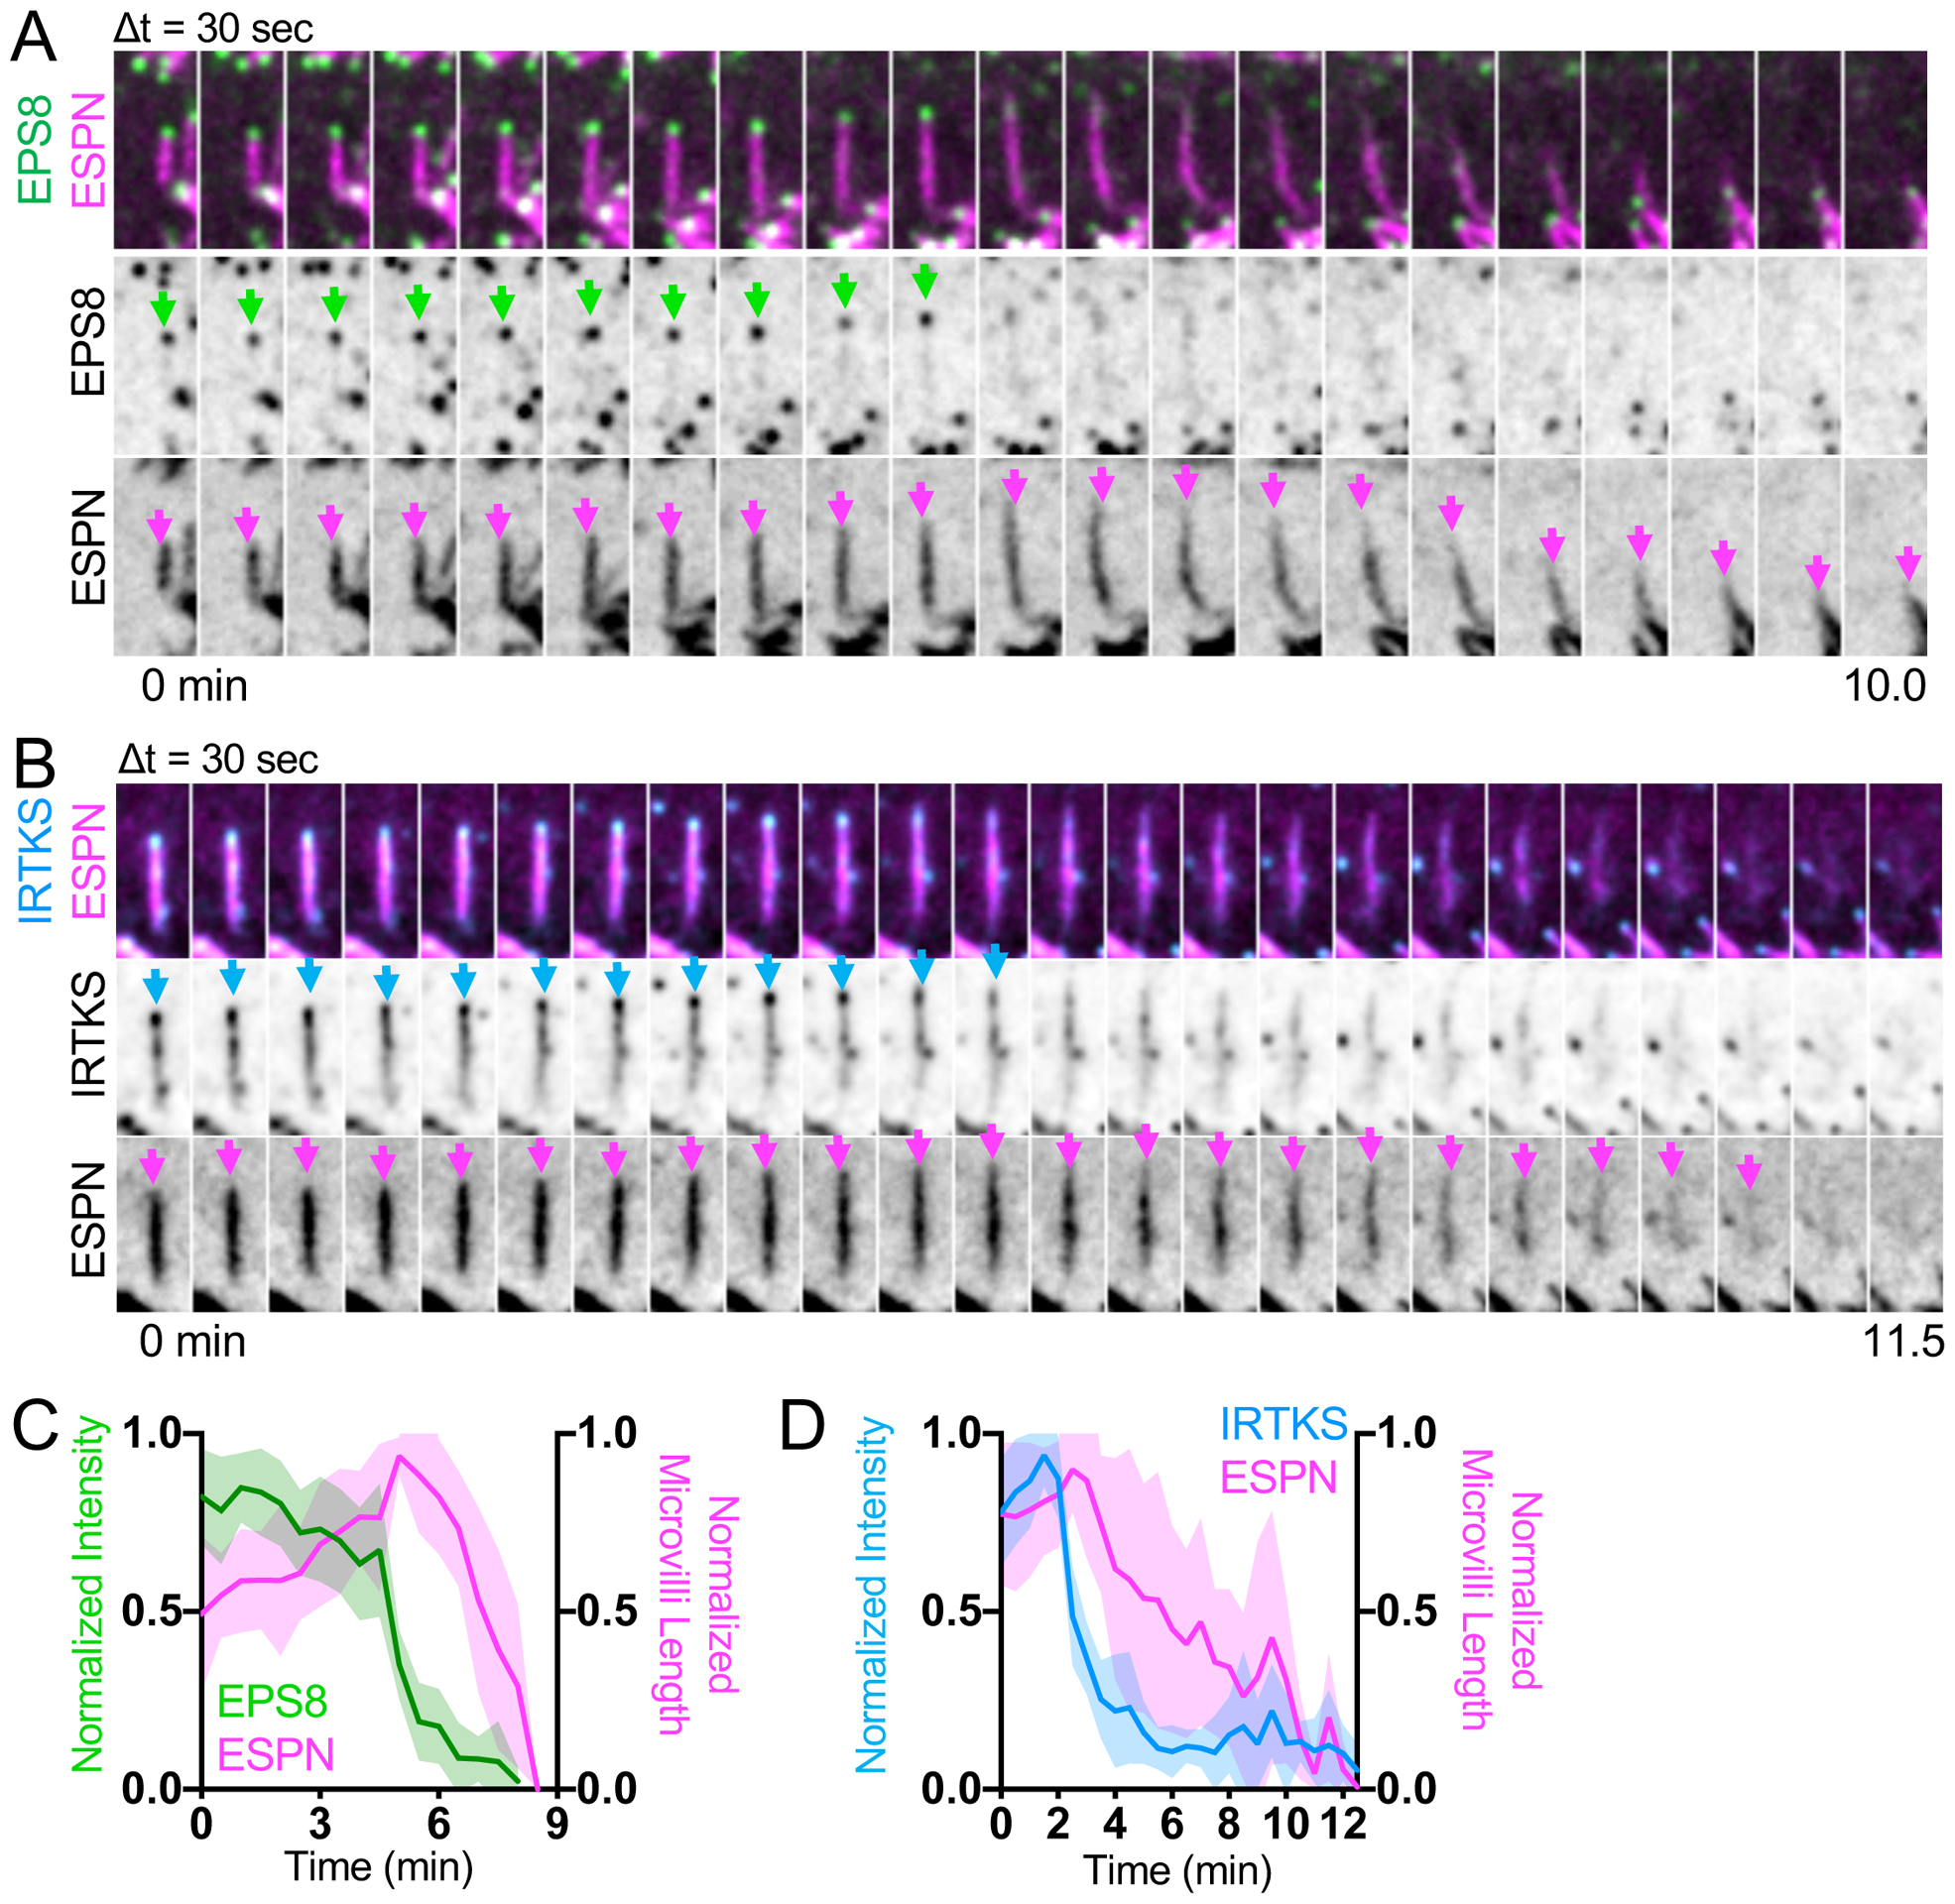
Figure 6. Microvilli cannot survive without EPS8 and IRTKS at the tips.

(A) Montage of a microvillus collapse event on the surface of a CL4 cell expressing EGFP-EPS8 and mCherry-ESPN. Green arrows denote tip targeted EGFP-EPS8 signal, whereas magenta arrows denote the core actin bundle. Box width = 2.5 μm. Related to Video S8. See also Figure S4. (B) Montage of microvillus collapse event in a cell expressing EGFP-IRTKS and mCherry-ESPN. Cyan arrows denote tip targeted EGFP-IRTKS signal. Magenta arrows denote the core actin bundle. Box width = 2.5 μm. (C) Quantification of EGFP-EPS8 intensity and microvilli length vs. time during microvillus collapse; n = 10 events from 6 cells. (D) Quantification of EGFP-IRTKS intensity and microvilli length vs. time during microvillus collapse; this plot was created by averaging traces of varying lengths ranging in duration from 4.5 – 12.5 min (IRTKS) and 4.5 – 12.5 min (ESPN); n = 12 events from 5 cells. For C, t = 0 is defined as −10 frames (5 min) before the drop in EGFP-EPS8 intensity from the tips of microvilli, whereas for D, t = 0 is defined as −5 frames (2.5 min) before the drop in EGFP-IRTKS intensity from the tips of microvilli. All images are represented as maximum intensity projections. For all curves, the solid line represents the mean and shading represents SD. See also Figure S4.
