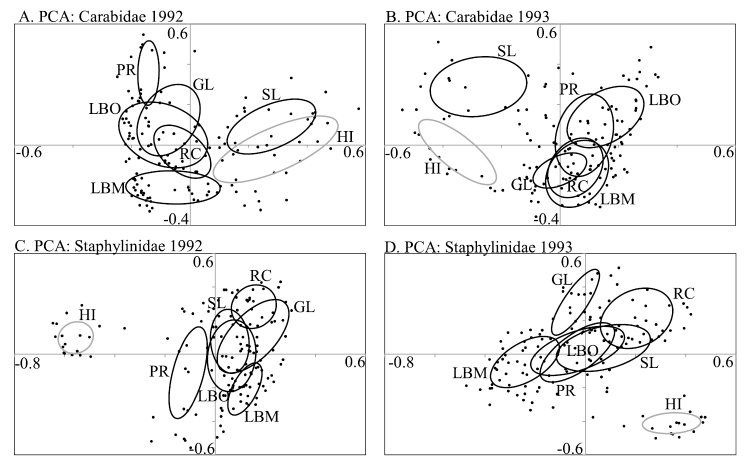
Figure 11.
Principal components analysis of epigaeic beetle assemblages in aspen-dominated mixedwood forests in north-central Alberta, 1992–93 ACarabidae, 1992 BCarabidae, 1993 CStaphylinidae, 1992 DStaphylinidae, 1993. Each point represents the catch from a single pitfall trap. Ellipses represent the standard deviation around the centroid of points in each group.

