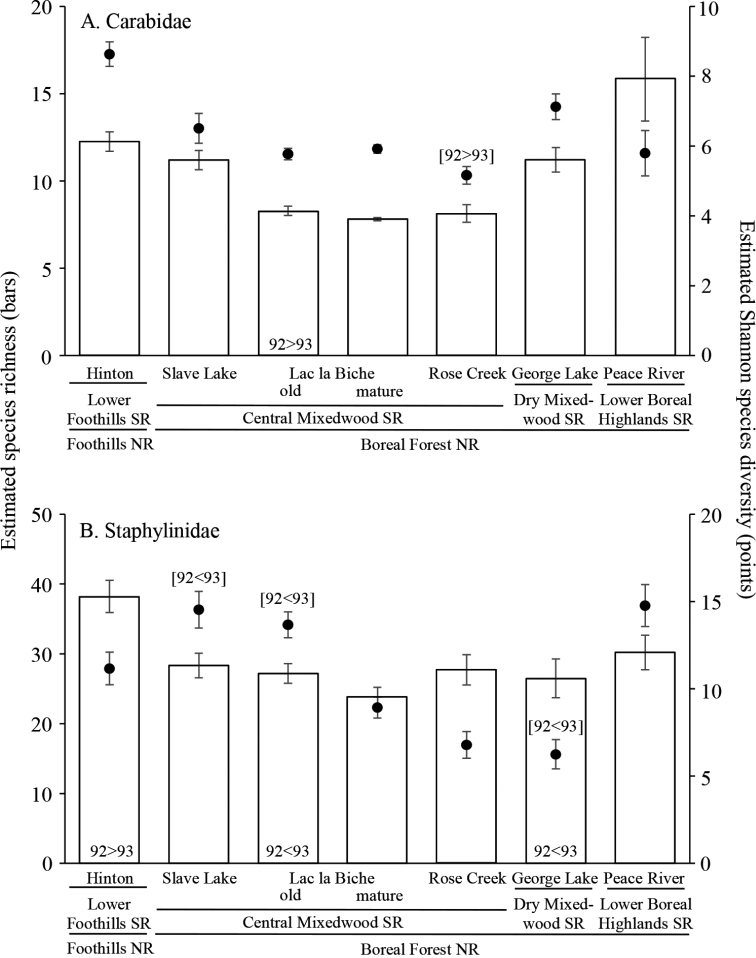
Figure 3.
Coverage based rarefaction estimates of species richness and diversity of epigaeic beetles at each location in aspen-dominated mixedwood forests of north-central Alberta, 1992–93. Locations are distributed across four Natural Subregions (SR) and two Natural Regions (NR) ACarabidae (97.2% coverage) BStaphylinidae (97.6% coverage). Bars represent species richness (± 95% CI) and points represent the exponential of the Shannon diversity index (± 95% CI). For locations where there was significant interannual variation, the results for species richness are placed at the bottom of each bar, and results for diversity are placed in square brackets [] and are indicated above the point for that location.

