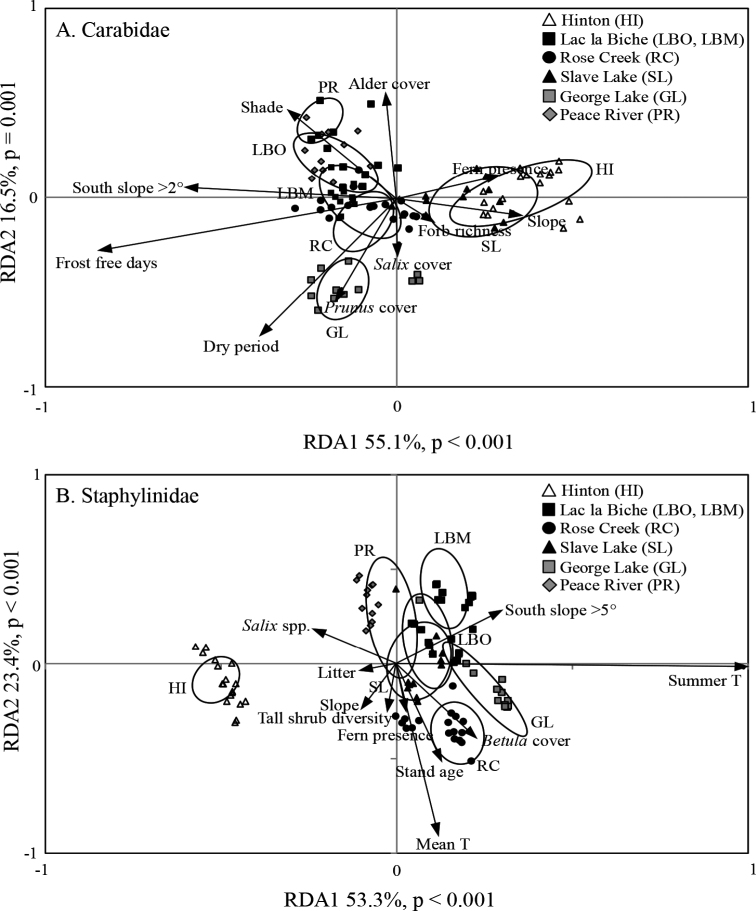
Figure 5.
Redundancy analysis of epigaeic beetle assemblages in aspen-dominated mixedwood forests in Alberta, 1992–93 ACarabidaeBStaphylinidae. Each symbol represents the catch from a single pitfall trap averaged over two years. Open symbols represent the Foothills Natural Region; the black symbols represent the Central Mixedwood Subregion, grey squares represent the Dry Mixedwood Subregion and the grey diamonds represent the Lower Boreal Highlands Subregion of the Boreal Forest Natural Region. Ellipses represent the standard deviation around the centroid of points in each group.

