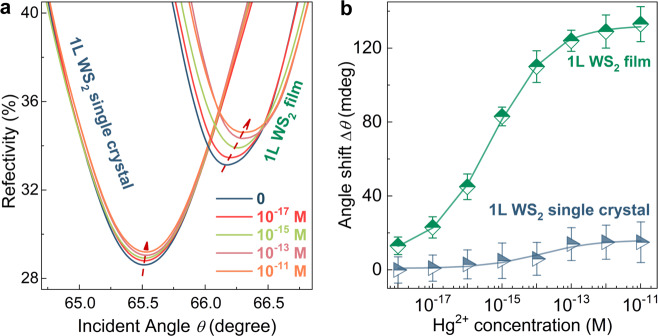
Fig. 2. Hg2+ detection of SPR sensor based on GB-rich 1L WS2 film and 1L WS2 single crystal.
a SPR spectra at Hg2+ concentrations ranging from 10−18 M to 10−11 M. b Corresponding extracted resonance angle shifts of ∆θ. For the prepared 10−18 M Hg2+ concentration, the x-axis error bar was estimated to be ±0.1 × 10⁻¹⁸ M (“Methods”). At each Hg2+ concentration, the collection of data was performed for 5 times, from which the average value of Δθ and y-error bar were determined.

