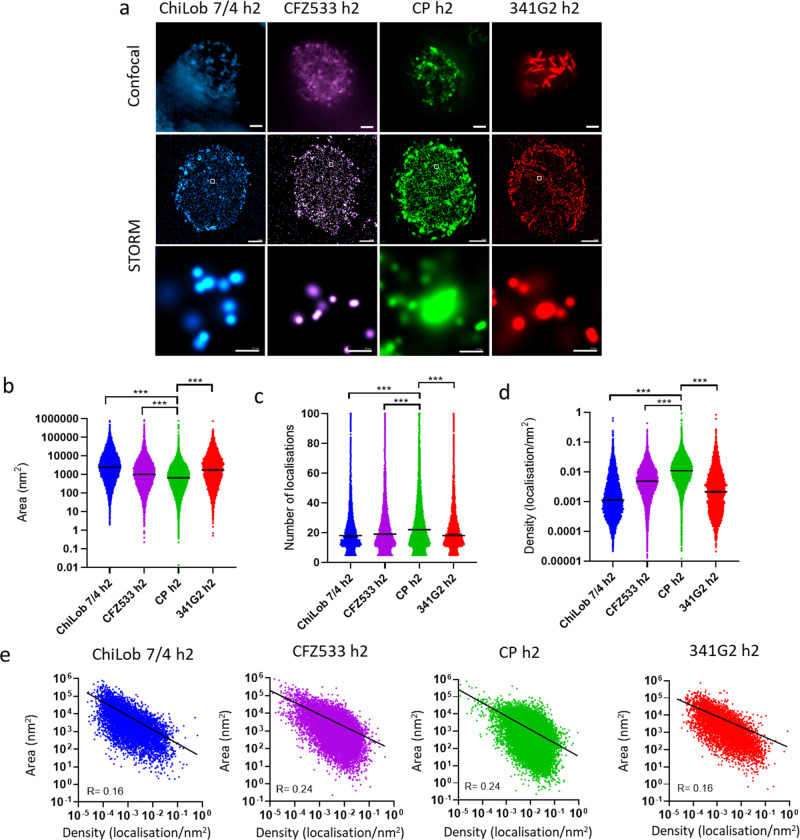
Fig. 3. STORM assessment of differential CD40 clustering induced by a range of CD40 agonists.
Jurkat cells expressing hCD40ECD-GFP were incubated with 50 µg/mL AF647-labelled anti-CD40 mAb at 37 °C for 1 h and then washed and fixed with 4% PFA. Cells were imaged using an ONI Nanoimager. a Representative confocal images (upper panel; scale bar, 2 µm), STORM images (middle panel; scale bar, 2 µm) and zoomed-in STORM image showing localisation patterns (lower panel; scale bar, 50 nm). Comparison of b area, c number of localisations and d density of clusters induced by various anti-CD40 mAbs as indicated, calculated by NimOS v1.6 software. Two-tailed, non-paired Student t test, *p < 0.05, **p < 0.01, ***p < 0.001. e Correlation between area and density of clusters induced by various anti-CD40 mAbs as indicated. Data are representative of three independent experiments.

