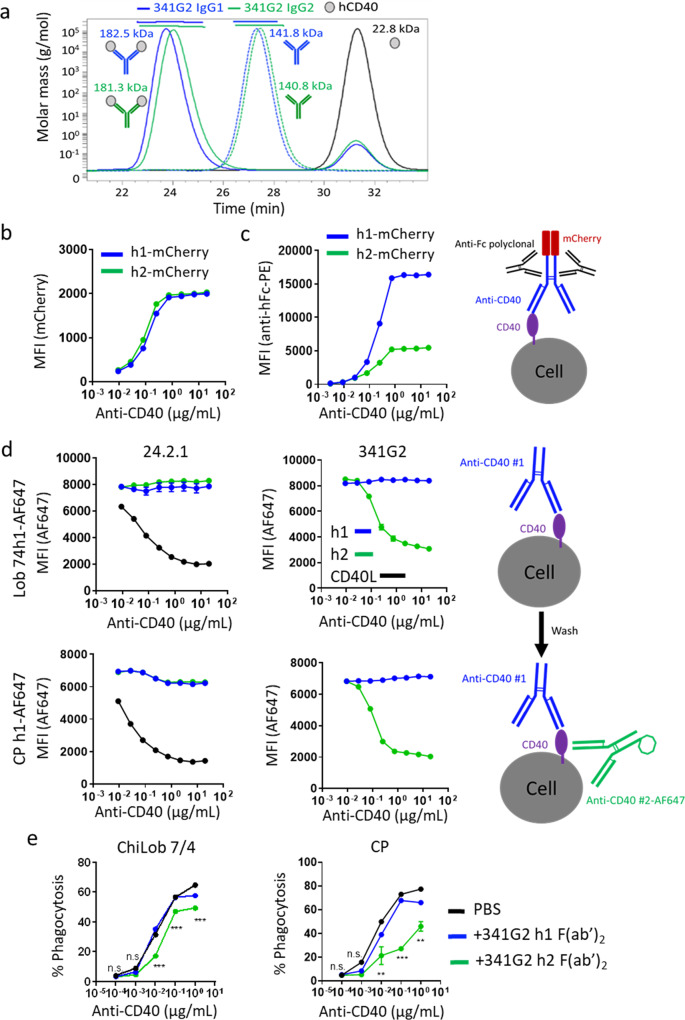
Fig. 5. Receptor clustering results in epitope shielding.
a Anti-CD40 mAb 341G2 h1 and h2 were co-incubated with recombinant soluble CD40ECD at room temperature for 30 min and then loaded onto a Superdex 200 HR10/30 column equilibrated with PBS and analysed by an in-line Dawn Heleos-II light scattering detector and an Optilab-rex refractive index monitor. Data analysis and molecular mass calculation were performed using ASTRA 6.1. The curve above each peak corresponds to the calculated molecular mass of each protein measured by the MALS. b Ramos cells were incubated with various concentrations of 341G2 h1-mCherry or 341G2 h2-mCherry and then washed and analysed for direct mCherry fluorescence by flow cytometry or c cells were further incubated with PE-conjugated polyclonal anti-hIgG Fc and then analysed for PE fluorescence by flow cytometry. d Ramos cells were pre-treated with unlabelled 341G2 or 24.2.1 h1, h2 or CD40L for 30 min before being washed and incubated with AF647-labelled ChiLob 7/4 h1 or AF647-labelled CP h1. AF647 fluorescence was detected by flow cytometry. Means ± SEM, n = 3, data representative of 3 independent experiments. e CFSE-labelled Ramos cells were pre-treated with 341G2 h1 F(ab’)2, 341G2 h2 F(ab’)2 or PBS control and then opsonized with various concentrations of ChiLob 7/4 h1 or CP h1 for 30 min before incubation with human monocyte-derived macrophages for 1 h for phagocytosis. CD14 was used to distinguish macrophages from Ramos cells. CD14+ CFSE+ cells represent macrophages that have undergone phagocytosis and were identified by flow cytometry. Means ± SEM, n = 2; two-way ANOVA followed by Sidak’s multiple comparisons were carried out for 341G2 h1 F(ab’)2 and 341G2 h2 F(ab’)2, *p < 0.05, **p < 0.01, ***p < 0.001, data representative of 2 independent experiments.

