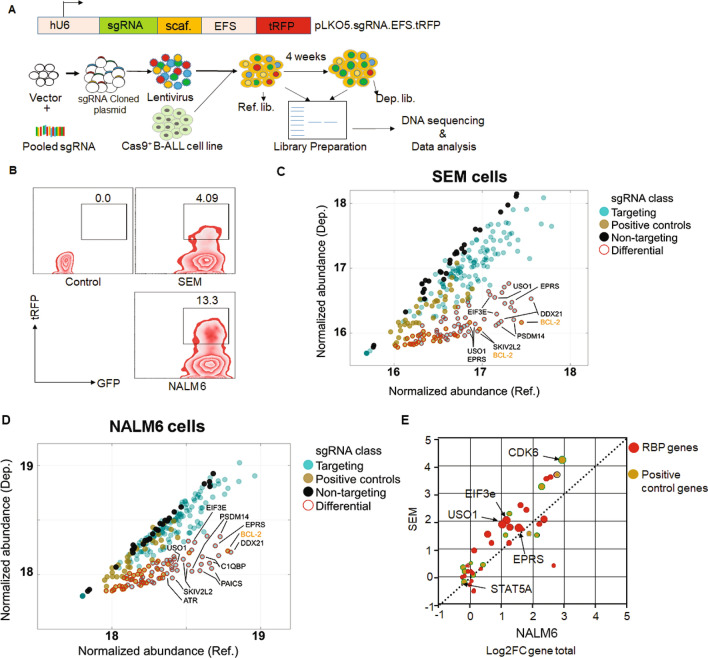
Figure 1.
Sub-genomic CRISPR screen identifies functionally important genes in MLL-AF4-translocated B-ALL. (A) Schematic of sub-genomic CRISPR screen. (B) FACS contour plots reflecting sorting strategy based on high expression of Cas9 (GFP) and pooled guide RNA library (tRFP) in B-ALL cell lines. (C, D) Variance-stabilized normalized abundance for individual sgRNAs in Reference (Ref; x-axis) and Depletion (Dep; y-axis) libraries in SEM (C) and NALM6 (D) cell lines. Dots are colored by sgRNA class (dark yellow: positive controls; black: non-targeting negative controls; teal: targeting sgRNAs). Dots highlighted with a red border were classified as differentially abundant (Log2 fold change [Log2FC] > 1, Wald adjusted p value < 0.001). Genes with three or more differential sgRNAs are highlighted in the inset and colored by class. (E) Differential expression of sgRNAs aggregated by gene (Log2FC gene total), in NALM6 (x-axis) vs SEM (y-axis) cell lines. Dots in the upper left represent genes with a higher fold-change in SEM cells, while those on the lower right represent genes with a higher fold-change in NALM6 cells. Dots are colored by sgRNA class and sized according to the number of individual sgRNAs that showed significant differential representation in the Dep libraries.

