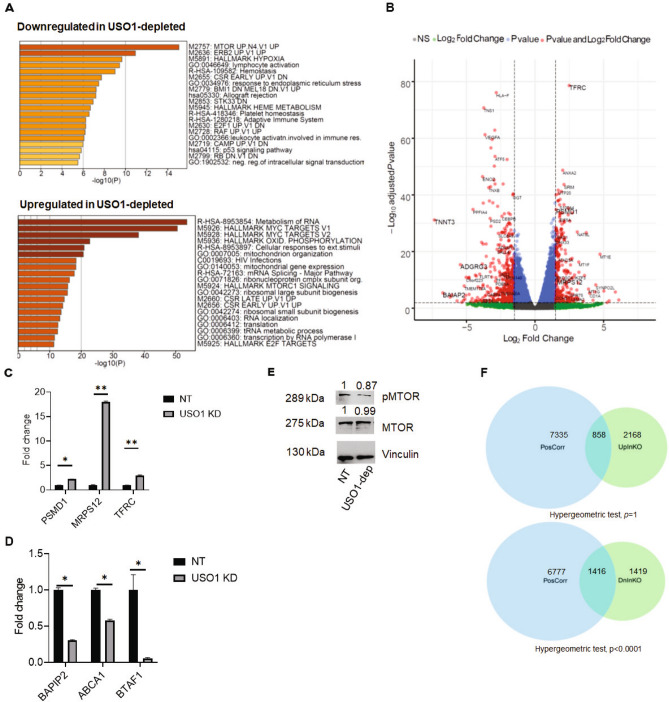
Figure 4.
USO1 depletion significantly affects gene expression and pathways related to cell survival and proliferation. (A) Enrichment plots generated by the Metascape gene list enrichment analysis webtool on for the RNA-seq data from USO1-depleted versus NT control SEM cells. The top and bottom panels show pathways that are downregulated and upregulated in USO1-depleted SEM cells, respectively. (B) Volcano plot representing differentially expressed genes (Padj < 0.01 and Log2FC > 1.5) with several examples highlighted from the pathways enriched in (A). (C, D) RT-qPCR validation of differentially expressed genes identified in (B) (t test; *P < 0.05; **P < 0.01) (E) Western blot showing mildly reduced expression of p-MTOR (Ser2481) expression in USO1-depleted cells, compared to NT control, while MTOR remains unchanged. (F) Venn diagrams showing the number of shared genes between USO1-positively correlated genes in Target-Phase II ALL dataset with the genes that are significantly upregulated (top) or downregulated (bottom) in USO1-depleted SEM cells. A hypergeometric test was utilized to compare the overlaps between the datasets using a genome size of 24,278 genes. Total and shared number of genes are indicated.

