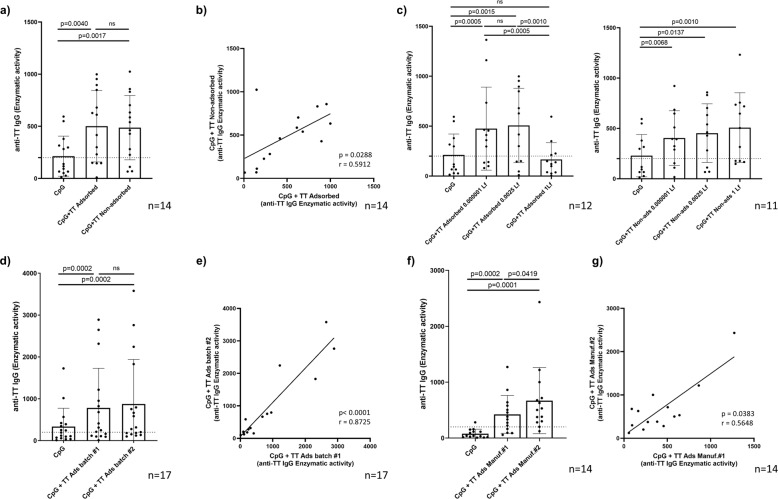
Fig. 4. Influence of adjuvant and batch-dependency of the response.
Impact of TT adsorption on alum and antigen concentration on anti-TT IgG production in buffy coat donors. a Comparison of response to TT adsorbed vs non-adsorbed (0.0025 Lf/ml) (14 donors; n = 7 independent experiments), b correlation of the enzymatic activity of anti-TT IgG in response to TT adsorbed and non-adsorbed (0.0025 Lf/ml) of individual donors (each represented as a single dot), c titration of TT adsorbed (left panel) (12 donors; n = 7 independent experiments) and titration of TT non-adsorbed (right panel) (11 donors; n = 7 independent experiments). d Comparison of the enzymatic activity of anti-TT IgG in response to two different batches from the same manufacturer (17 donors; n = 4 independent experiments) and e correlation of the means of enzymatic activity of anti-TT IgG of the individual donors in response to the batch #1 and #2 (each donor represented as a single dot) (n = 4 independent experiments). f Comparison of the enzymatic activity of anti-TT IgG in response to adsorbed TT from two different manufacturers (14 donors; n = 3 independent experiments) and g correlation of the means of enzymatic activity of anti-TT IgG of the individual donors in response to the TT adsorbed from Manufacturer #1 and #2 (each represented as a single dot). Bar graphs represent mean (± standard deviation) of the enzymatic activity means of all donors. The dotted line shows anti-TT IgG enzymatic activity of 200, the threshold of reactivity. Data were analyzed using Wilcoxon matched-pairs signed rank test and Spearman correlation. P values are depicted in the respective graphs, ns non-significant.

