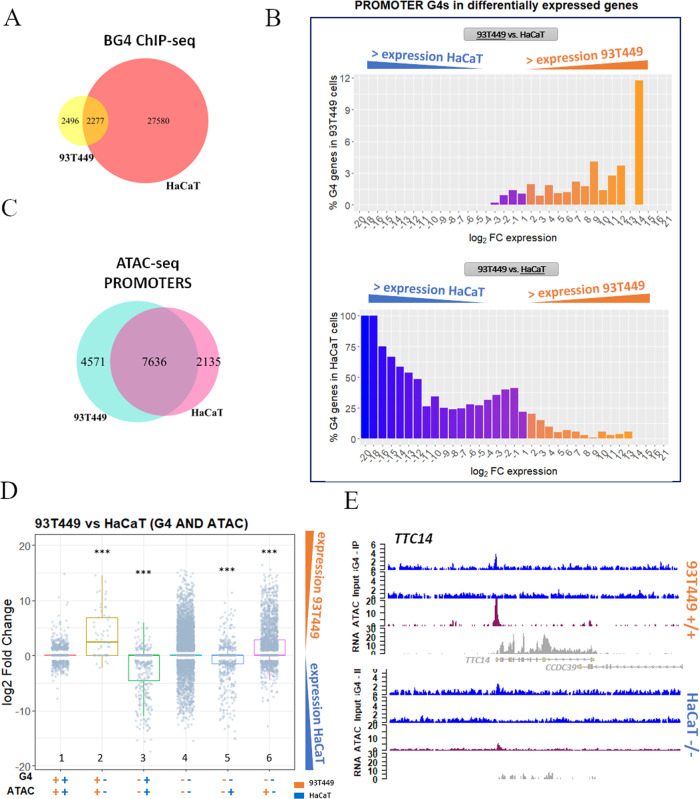
Fig. 4. Comparison of 93T449 and HaCaT cell lines.
A Venn diagram showing the intersection between G4 peaks found in 93T449 (yellow) and HaCaT (salmon) cell lines. B Percentage of genes containing at least one G4 in their promoter in 93T449 (upper panel) or HaCaT (lower panel) cells, in function of their differential expression in the two cell lines expressed as log2 fold change (FC). Orange and blue-violet bars in both panels correspond to genes that have higher expression in 93T449 cells and HaCaT cells, respectively. C Venn diagram showing the intersection between the ATAC-seq peaks found in promoters of 93T449 (light blue) and HaCaT (pink) cell lines. D Differential gene expression comparison of the same genes in 93T449 and HaCaT cells, based on the presence of G4s and open chromatin combinations. Orange and blue symbols indicate data for 93T449 and HaCaT cells, respectively. The presence (+) or absence (−) of G4s or ATAC signals are reported. Bars indicate gene expression distribution of the differentially expressed genes in 93T449 vs HaCaT cells evaluated by two-sided T test in comparison to the G4:ATAC ++/++ condition (CI 95%, ***p value < 0.001). Exact p values are the following: +−/+− p = 2.3e−16, −+/−+ p < 2.22e−16, −−/−+ p = 3e−8, −−/+− p = 4e−7. The box plots central line represents the median, the bottom, and upper bounds of the box represent the 25th and 75th percentile, respectively, and the whiskers represent the lowest and highest score, excluding outliers. G4:ATAC ++/++ n = 1098, +−/+− n = 61, −+/−+ n = 435, −−/−− n = 14,717, −−/−+ n = 649, −−/+− n = 2315. E Genomic view showing representative regions of 93T449 and HaCaT cell lines gene expression (RNA-seq track, gray) with respect to the presence of G4 peaks (ChIP-seq, blue) and open chromatin (ATAC-seq, purple). In particular, TTC14 gene is displayed, which shows both G4 and ATAC signals in 93T449 cells, while it shows limited accessibility and no G4 in HaCaT cells. These differences are reflected in the corresponding RNA amount, which is much lower in HaCaT cells. Source data for each panel are provided or referenced in the Source data file.

