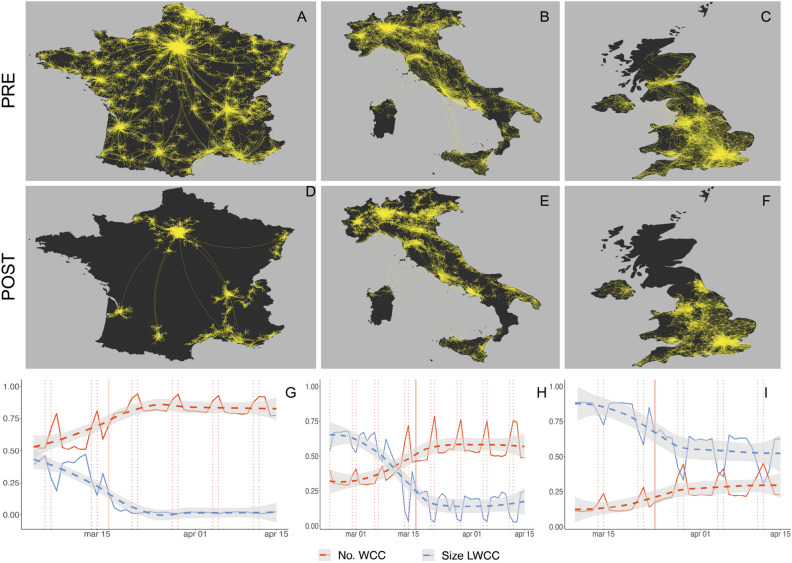
Figure 1.
Outlook on national mobility networks for France, Italy and UK during COVID-19 pandemic. Panels (A–F) show the largest weakly connected components (LWCC) of national mobility networks built on two disjoint symmetric windows: respectively 2 weeks before (panels A–C) and 2 weeks after (D–F) the day of national lockdown. The lockdown dates are respectively March 17th for France, March 9th for Italy and March 24th for UK. Bright dots represent municipalities that belong to the LWCC. We observe the following reductions in terms of nodes that disappear from the main cluster. France: from 5495 to 1174 nodes. Italy: from 2733 to 2293 nodes. UK: from 1072 to 844 nodes. Panels (G–I) show the temporal evolution of daily connectivity for national mobility networks of municipalities, in terms of number of weakly connected components (No. WCC) and size of the largest weakly connected component (LWCC). Both quantities are normalized using the number of nodes of the corresponding network. We visualize trends by means of a LOESS regression (dashed lines with 95% confidence intervals shaded in grey) and highlight lockdown and week-end days with vertical red lines, respectively solid and dashed .

