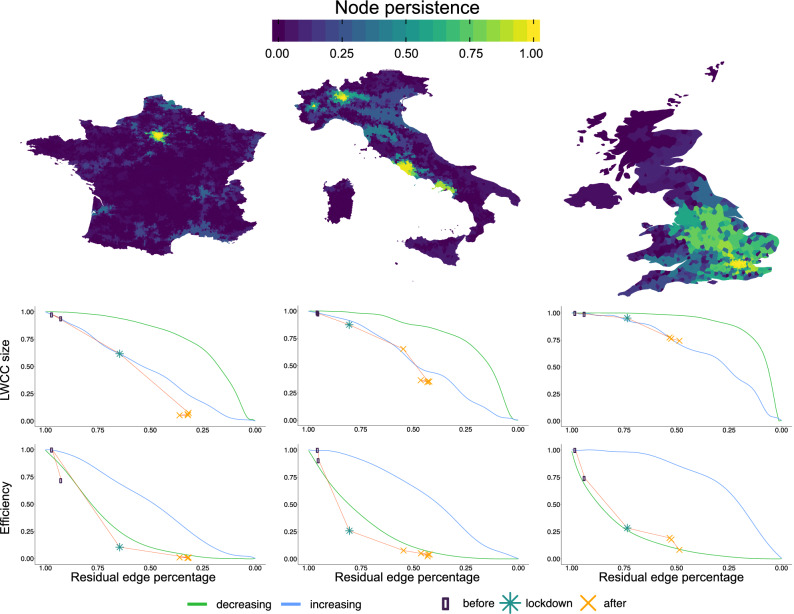
Figure 3.
Results of the percolation process in terms of node persistence and edge removal strategies. A percolation process is performed by iterating a cutting procedure on edges according to their weights calculated in the whole period before lockdown. Top row: node persistence during the percolation process. Node persistence is defined as the number of iterations a node remains connected to the LWCC over the maximum number of iterations before the network is completely disconnected; the more persistent the node, the brighter the color. Notice that we are defining persistence upon deleting edges by their increasing strength: hence, brighter nodes are not only the last to be disconnected, but are also those embedded in stronger mobility flows. Middle row: size of the LWCC (largest weakly connected component) as a function of the number of residual edges. Green and blue curves correspond to deleting edges respectively in decreasing and increasing order of their weight. Bottom row: variation of global network efficiency obtained deleting edges by increasing (green) or decreasing (blue) weight. In both middle and bottom rows, we plot the “empirical” values of LWCC and global efficiency for the mobility networks calculated aggregating flows in the weeks before (dots), during (stars) and after (cross) the lockdown date. Notice that, while lockdown cut out the peripheries of national networks (middle panels, but see also panels (D–F) of Fig. 1), the reduced mobility severely affects also the network efficiency (bottom panels).

