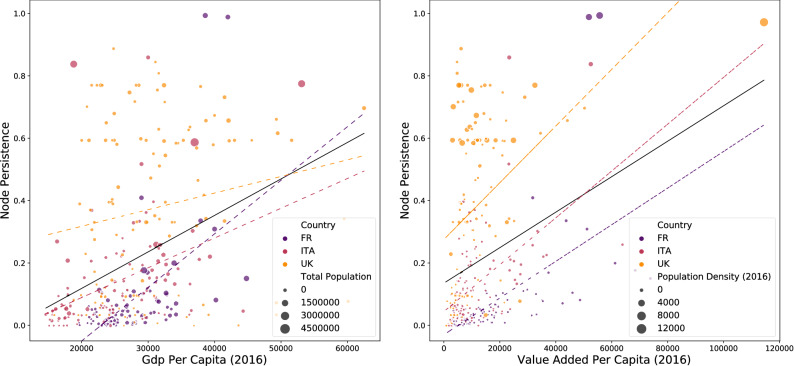
Figure 4.
Correlation of node persistence with economic and demographic variables. Left panel: correlation between Node Persistence and GDP per Capita in 2016, with the size of nodes corresponding to Total Population in 2018. Right panel: correlation between Node Persistence and Value Added per Capita in 2016, with the size of nodes corresponding to Population Density in 2018. Overall correlation is significantly positive with respect to GDP per Capita (P–R: ; S–R: ; K–T: ) and Valued Added per Capita (P–R: ; S–R: ; K–T: ). Country correlations with Value Added per Capita are positive and significant for all countries, while for GDP per Capita are positive and significant only for Italy and France but not for UK (full results reported in section “Materials and methods”). Nodes have been aggregated at the province level to match economic variables. Colors of scatter points correspond to three countries in the sample. Full sample regression line reported as the continuous black line, while regressions lines for single countries are reported as colored dashed lines. Top 1% of the nodes by GDP Per Capita (left) or Value Added per Capita (right) has been removed to avoid the influence of outlier values and ease visualization (correlation results for the full sample are reported in “Materials and methods”).

