Figure 1.
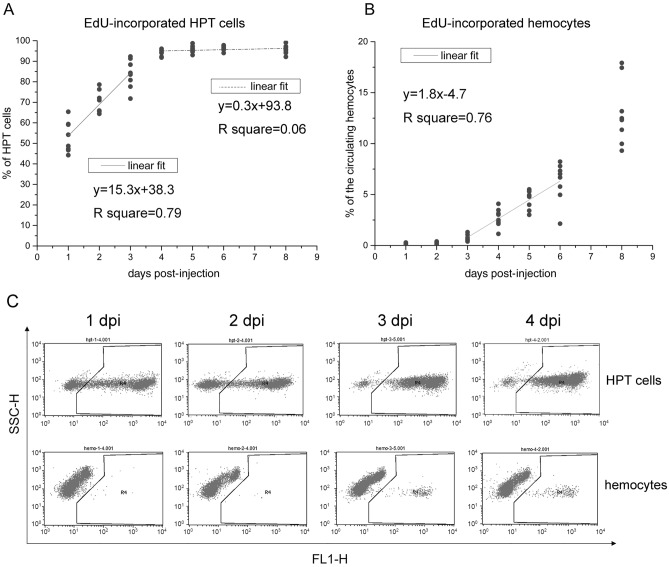
The renewal rate of circulating hemocytes. Crayfish were injected with one dose of EdU. HPT cells and circulating hemocytes were collected at different time points until 8 dpi. After fixation, cells were stained for EdU and analyzed by flow cytometry. Over 10,000 cells were analyzed for each sample. The percentages of EdU-incorporated cells in the HPT (A) and circulation (B) are shown with percentage-time scatter plots. Eight animals were analyzed at each time point. The relationships between time and EdU incorporation percentages were modeled using linear regression (1 ~ 3 dpi and 4 ~ 8 dpi for HPT cells; 3 ~ 6 dpi for circulating hemocytes). (C) Typical FL1-SSC scatterplots obtained in flow cytometry analysis (HPT cells, upper panel; hemocytes, lower panel). Cells in the right region of each plot are EdU-incorporated.

