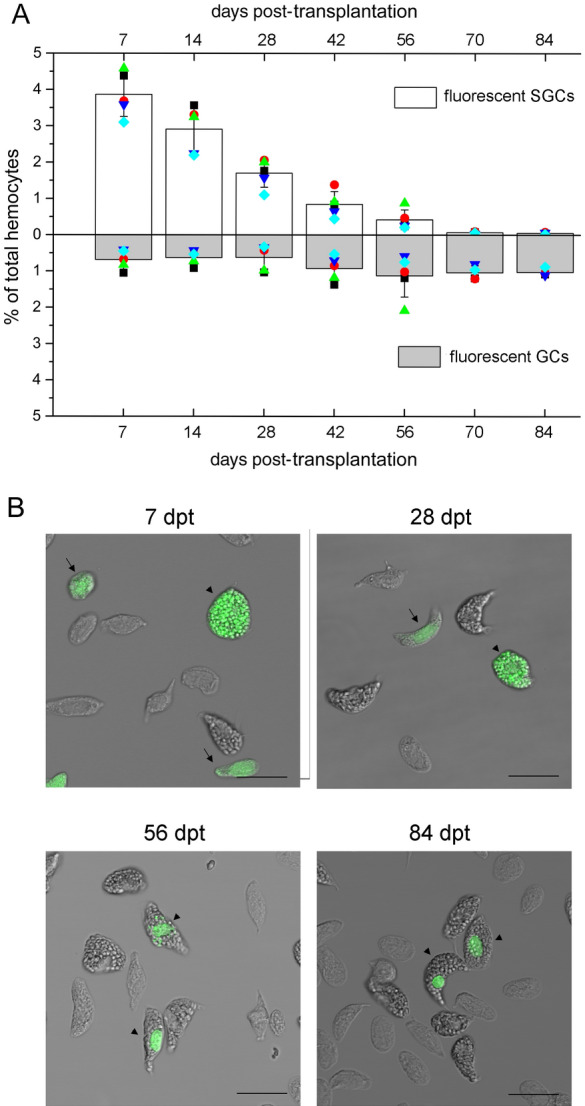
Figure 4.

Almost all transplanted hemocytes develop into GCs. Hemocytes were isolated from donor crayfish, labeled with a nontoxic fluorescence cell tracer (green) and transplanted into recipients. Hemocytes were taken from the recipients and analyzed at different time points. The percentages of fluorescent GCs and SGCs in the total hemocytes were determined by flow cytometry and fluorescence microscopy. Over 10,000 cells were analyzed for each sample (A). Five animals were used in each group. Data from different individuals are indicated by different symbols. Images of transplanted cells are shown (B). Fluorescent SGCs are indicated with arrows, and fluorescent GCs are indicated with arrowheads. Bar, 25 μm.
