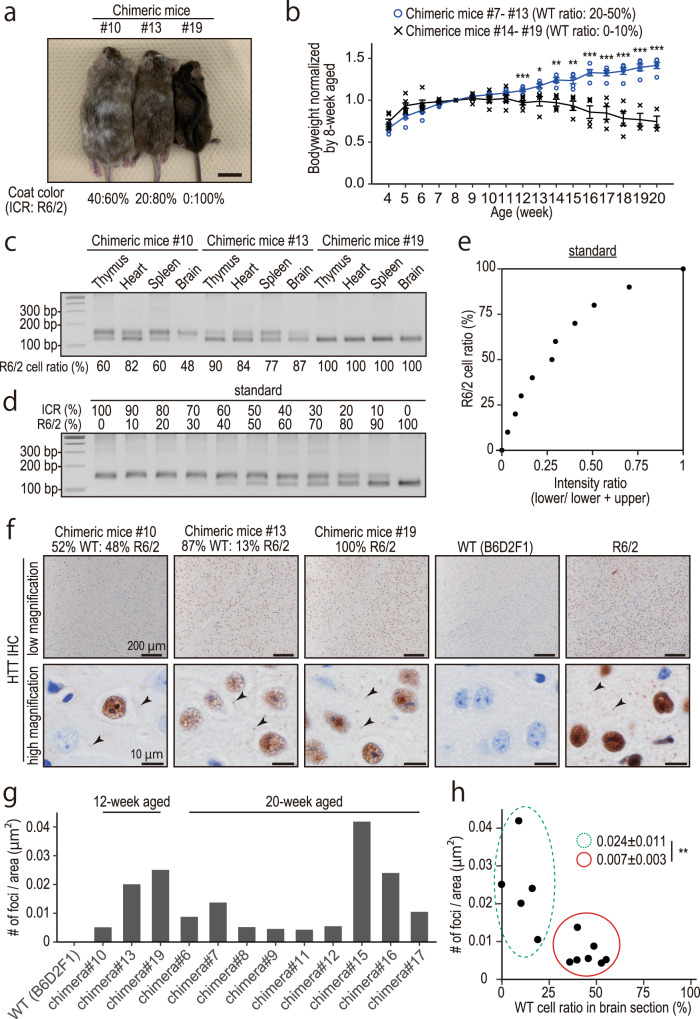
Fig. 5. Phenotyping of R6/2-ESC- > ICR chimeric mice.
a Chimeric mice and their chimeric ratio estimated by their coat color (ICR: white, R6/2-ESC: agouti). b Growth curve of chimeric mice. Chimeric mice were divided into two groups depending on their chimera ratio. Error bars indicate standard error. Statistical analysis was performed using a two-tailed student’s t-test (p-value = 0.00089 [12 week], 0.0216 [13 week], 0.00128 [14 week], 0.00299 [14 week] <0.001 [~15 week]). c–e A microsatellite D15Mit266 was examined with PCR to determine the ESC contribution rate. The mixture of ICR and R6/2-ESC genomic DNA was used as the standard (d, e; approximate line: y = 102x3 − 262x2 + 259x + 1.96). Brain genomic DNA was extracted from the serial section examined in f. f Immunohistochemistry with anti-human HTT antibody. Black arrowheads indicate HTT aggregates. g The number of foci was calculated in randomly chosen three areas. h Relationship between the number of foci and R6/2 cell ratio in the brain. Each dot represents one animal. Green dashed circle and red circle indicate chimeric mice with less than 20% and more than 30% of WT cells, respectively. The error range (±) indicates standard deviation. Statistical analysis was performed using a two-tailed student’s t-test (p-value = 0.0090).

