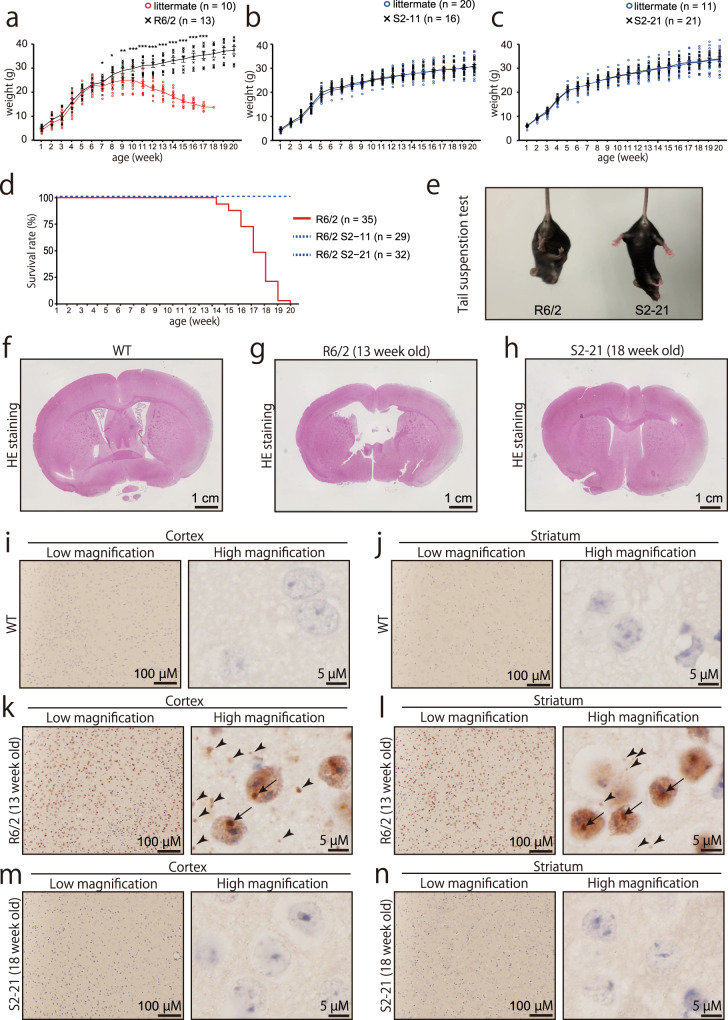
Fig. 6. Phenotypic analysis of R6/2 and isogenic mice produced from repeat-corrected ES cells.
a–c Growth curve of R6/2 (a) and genome-edited (b, c) mice. Male mice were used for plotting and data analysis. Statistical analysis was performed using a two-tailed student’s t-test (p-value = 0.033 [8 week], 0.018 [9 week], 0.004 [10 week], <0.001 [~11 week]). d Survival curve of R6/2 and genome-edited mice. e Tail suspension test of R6/2 (left) and isogenic mice (right). See supplemental video 1. f–h Histological analysis with H&E staining of R6/2 (g; 13 week old) and isogenic mice (h; 18 week old). Isogenic mice were analyzed at the age when almost all R6/2 mice were dead. i–n Immunohistochemistry with anti-human HTT antibody. Black arrows and arrowheads indicate HTT aggregates inside and outside the nucleus, respectively.

