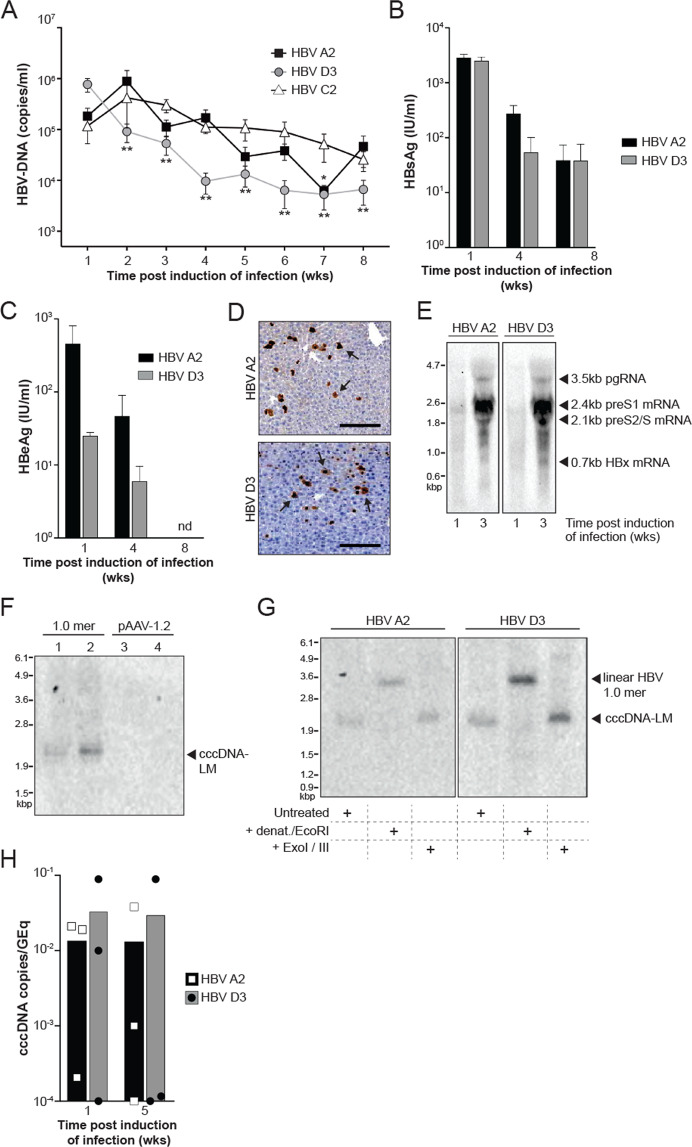
Fig. 2. HBV replication and formation of cccDNA-Like molecules in C57BL/6 mice.
A Serial measurement of serum HBV DNA levels in C57BL/6 mice after induction of infection with HBV 1.0 mers. Data are represented as mean ± s.e.m. from three independent experiments (n = 15 for genotype A2, n = 12 for genotype D3, n = 15 for genotype C2). Statistical analyses using unpaired two-tailed t tests were performed comparing each week with week 1. *P < 0.05, **P < 0.01. B Quantitative analysis of HBsAg in serum of C57BL/6 mice at indicated time points after induction of infection with HBV 1.0 mers. Data are represented as mean ± s.e.m. from two independent experiments (n = 12 for genotype A2, n = 11 for genotype D3). C Quantitative analysis of HBeAg in serum of C57BL/6 mice at indicated timepoints after induction of infection with HBV 1.0 mers of indicated genotypes. Data are represented as mean ± s.e.m. from two independent experiments (n = 12 for genotype A2, n = 11 for genotype D3). nd = non-detectable. D Immunohistochemistry staining of HBV core antigen positive cells in liver sections of C57BL/6 mice one week after induction of infection with the indicated HBV genotypes, arrows indicate HBcAg-positive stained liver cells, n = 6 per group, scale bars: 125 μm. Data is representative of two independent experiments. E Northern blot analysis of total liver HBV RNA from C57BL/6 mice at indicated time points after induction of HBV infection with indicated genotypes. Data is representative of two independent experiments. F Southern blot analysis of HBV DNA extracted by Hirt-lysis from total liver of C57BL/6 mice 3 weeks post induction of infection with HBV 1.0 mer, genotype D3 (lanes 1 and 2) in comparison to mice transfected with pAAV-HBV1.2 plasmid DNA, genotype A2 (lanes 3 and 4). Data is representative of two independent experiments. G Southern blot analysis of HBV DNA extracted by Hirt-lysis and exposed to heat denaturation and EcoRI digest or Exo I/III digest in comparison to untreated DNA from total liver of C57BL/6 mice 3 weeks post induction of infection with HBV 1.0 mer (genotype A2 or D3). Results are representative of three independent experiments. H Quantification of HBV cccDNA from total liver of C57BL/6 mice 1- and 5-weeks post induction of infection with HBV 1.0 mer (genotype A2 and D3) and treatment with specified compounds. Data are represented as mean (n = 3 per time point). HBV cccDNA levels expressed as a ratio of cccDNA copies per genomic equivalents (GEq). The limit of detection is 1 cccDNA copy/2 mg of liver.

