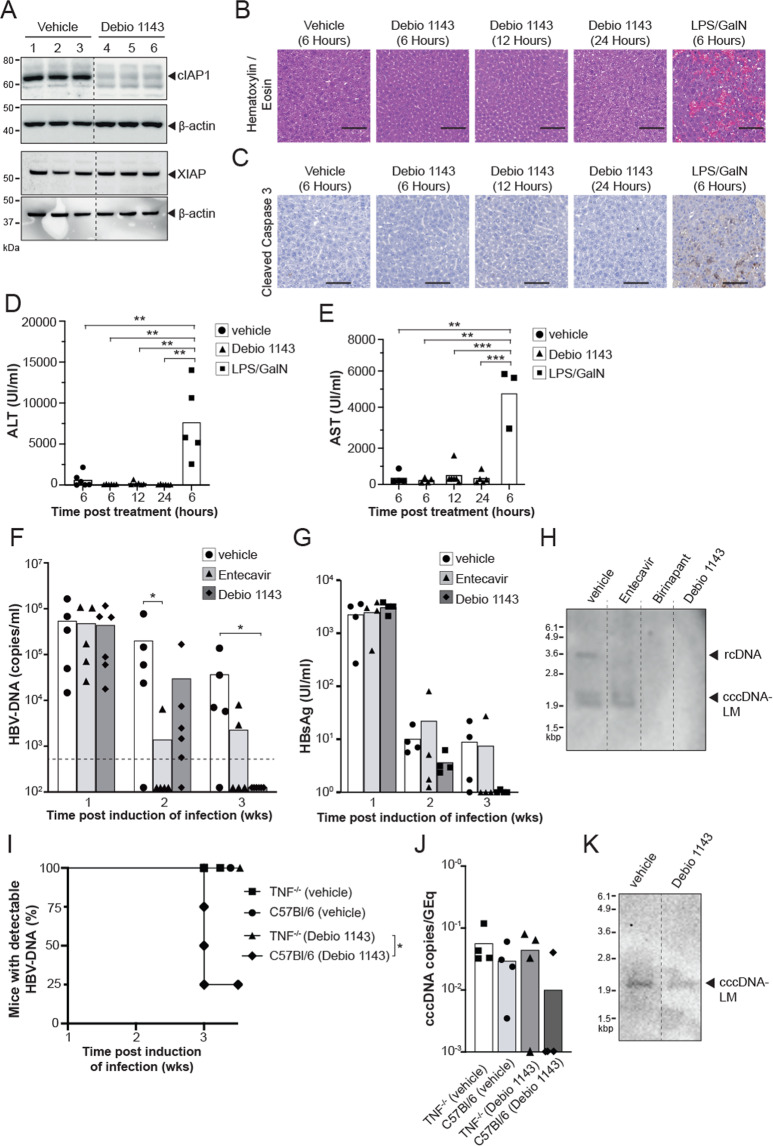
Fig. 3. Debio 1143 promotes clearance of HBV infection in C57BL/6 mice.
A Western blot analysis of cIAP1, XIAP (black arrow), and β-Actin protein levels in the liver of naive C57BL/6 mice 18 h after a single dose of vehicle or Debio 1143 treatment (n = 3 mice per group, indicated by numbers above blots). Data is representative of three independent experiments. B Hematoxylin and eosin staining of liver sections of uninfected C57Bl/6 mice at indicated timepoints after a single dose of vehicle, Debio 1143 or LPS/GalN (n = 3 mice per group). Data is representative of two independent experiments. Scale bars = 100 µM. C Immunohistochemistry staining of cleaved caspase-3 in liver sections of uninfected C57Bl/6 mice at indicated timepoints after a single dose of vehicle, Debio 1143 or LPS/GalN. (n = 3 mice per group). Data is representative of two independent experiments. Scale bars = 100 µM. D Serum alanine aminotransferase (ALT) levels at indicated timepoints after a single dose of vehicle, Debio 1143 or LPS/GalN. Data are represented as mean (n = 5–6). Statistical analyses using unpaired two-tailed t tests were performed **P < 0.01. E Serum aspartate aminotransferase (AST) levels at indicated timepoints after a single dose of vehicle, Debio 1143 or LPS/GalN. Data are represented as mean (n = 3–6). Statistical analyses using unpaired two-tailed t tests were performed **P < 0.01, ***P < 0.001. F Serial measurement of serum HBV DNA levels in C57BL/6 mice after induction of HBV infection with HBV 1.0 mers (genotype D3) and treatment with specified compounds at indicated timepoints. Dashed line indicates assay detection limit of 500 HBV DNA copies/ml. Representative data of two independent experiments shown as mean (n = 5 for vehicle, n = 5 for Entecavir, n = 6 for Debio 1143). Statistical analyses using unpaired two-tailed t tests for parametric data and Holm–Sidak correction for multiple t tests was performed. *P < 0.05. G Measurement of serum HbsAg in C57BL/6 mice after induction of HBV infection with HBV 1.0 mers (genotype D3) and treatment with specified compounds at indicated timepoints. H Southern blot analysis of HBV DNA extracted by Hirt-lysis from total liver of individual C57BL/6 mice 3 weeks post induction of infection with HBV 1.0 mer (genotype D3) and treatment with specified compounds. Results are representative from three independent experiments. I Proportion of animals and time when TNF−/− or C57BL/6 mice after induction of HBV infection with HBV 1.0 mers (genotype D3) and treatment with Debio 1143 or vehicle first achieved an undetectable serum HBV DNA level. Data are represented as mean (n = 4). Statistical analyses using log-rank Mantel–Cox test was performed *P < 0.05. J Quantification of HBV cccDNA from total liver of individual TNF−/− and C57BL/6 mice 3 weeks post induction of infection with HBV 1.0 mer (genotype D3) and treatment with specified compounds. Data are represented as mean (n = 4 per group). HBV cccDNA levels expressed as a ratio of cccDNA copies per genomic equivalents (GEq). The limit of detection is 1 cccDNA copy/ 2 mg of liver. K Southern blot analysis of HBV DNA extracted by Hirt-lysis from total liver of individual TNF−/− mice 3 weeks post induction of infection with HBV 1.0 mer (genotype D3) and treatment with specified compounds.

