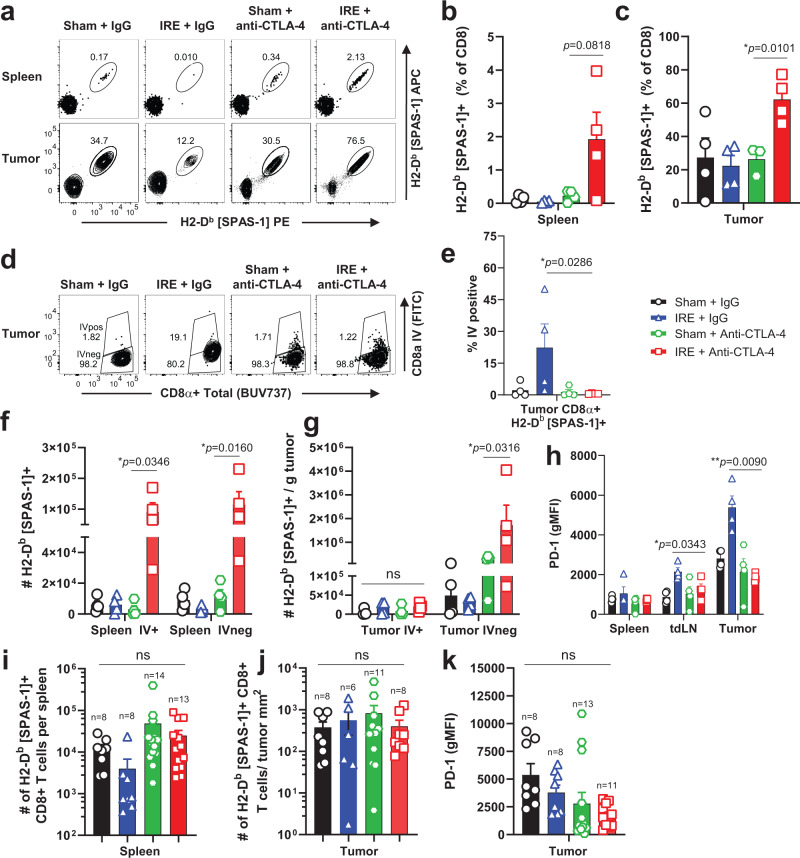
Fig. 6. Combination therapy is associated with increased numbers of tumor-specific SPAS-1+ T cells in spleen and tumors.
Mice bearing ~4–5 mm diameter TRAMP-C2 tumors were treated with Sham, IRE, and/or anti-CTLA-4 as in Fig. 4. On day 14 (a–h) or day 21 (i–k) following therapy, single-cell suspensions from the indicated tissues were analyzed by flow cytometry. Data in (b–h) represent individual mice (n = 4/group) pooled from two independent experiments, and i–k represent individual mice (n = 6–14/group) pooled from four independent experiments, with exact n shown for each group. a Representative tetramer staining of SPAS-1 from spleen and tumor samples in each treatment group, gated on Live, Thy1.2+ CD8+ T cells. b, c Frequency of SPAS-1+ T cells in spleen and tumor, respectively. Intravascular (IV) anti-CD8α was injected 3 min prior to sacrifice. d, e Representative flow cytometry plots and quantification, respectively, gated on Thy1.2+ CD8 + SPAS-1+ T cells, showing IV CD8α stain used to segregate the IV-negative and -positive fractions from each treatment group. f–g Total number of SPAS-1+ CD8+ T cells in the indicated IV fraction of spleen and tumor, respectively. h, k PD-1 expression at days 14 and 21, respectively. i–j Total number of SPAS-1+ T cells in the IV-negative fractions of spleen and tumor, respectively at day 21 following the start of therapy. Bars represent mean ± S.E.M. b, c, e–k, Unpaired two-tailed T test with Holm-Sidak’s correction was performed; ns, not significant, *p < 0.05, **p < 0.01. Source data are provided as a Source Data File.

