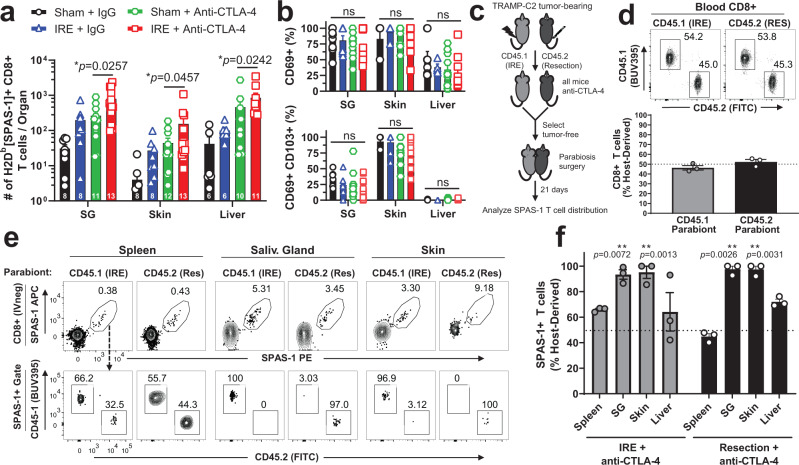
Fig. 7. Combination therapy is associated with increased numbers of tissue-resident memory SPAS-1+ T cells in non-lymphoid tissues.
Mice bearing TRAMP-C2 tumors were treated as in Fig. 4. a 21 days following therapy, the number of SPAS-1 + T cells was quantified by flow cytometry from the indicated tissues. b Percentage of SPAS-1+ T cells identified in (a) that express CD69 (top panel) or CD69 and CD103 (bottom panel). Data in (a, b) represent individual mice (n = 8–13/group) pooled from four independent experiments, with exact n for each group shown at the base of each bar for each tissue. The exact n values for the number of samples analyzed in (b) are shown in the Source Data File. c TRAMP-C2 tumors were inoculated i.d. into CD45.1 and CD45.2 mice and tumors were removed by IRE or surgical resection, respectively, followed by anti-CTLA-4, every third day for four total doses. Mice that cleared tumors were selected and rested for three additional weeks, and parabiosis surgery was performed. d Flow cytometry of blood collected from each partner mouse 17 days after surgery, showing the fraction of host-derived total CD8+ cells from each parabiont in a representative FACS plot (top) and quantified for 3 pairs of mice (bottom). e After 21 days of equilibration, mice in each pair were individually injected i.v. with 3 µg of FITC-labeled anti-CD8α antibody 3 min prior to harvest, to mark CD8+ T cells in the circulation. Single-cell suspensions from the indicated organs were prepared and stained for flow cytometry. Top row, SPAS-1+ T cell gating from the IV-CD8+ T cell population from the indicated organs of each congenically distinct partner is shown. Bottom row, SPAS-1+ T cells from each partner are discriminated by CD45.1 and CD45.2 to determine the partner of origin. f Quantification of data from 3 parabiotic pairs, separated by treatment group. The proportion of SPAS-1+ T cells in each tissue that were derived from the host mouse is presented as a fraction of the total from both host and donor mice. a–b Data pooled from four independent experiments. Unpaired two-tailed Mann–Whitney test was performed; *p < 0.05. c–f Data representative of one experiment with 3 parabiotic pairs. One sample T test with a hypothetical value of 50 was performed; ns, not significant; **p < 0.01. All bars represent mean ± S.E.M. SG salivary gland. Source data are provided as a Source Data File.

