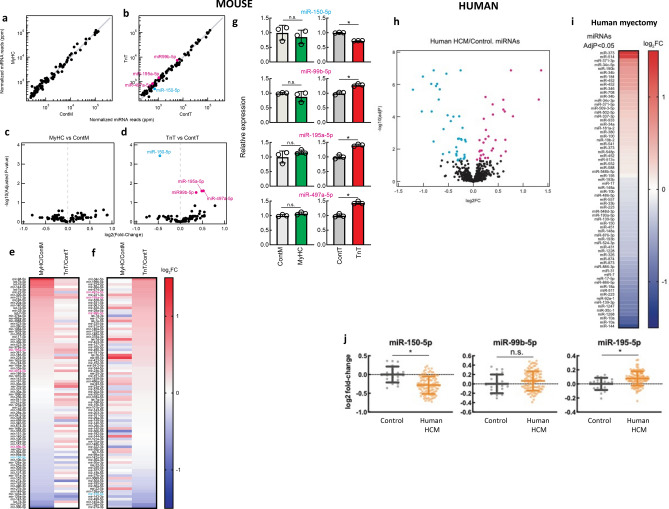
Figure 2.
Global miRNA-seq analysis of MyHC-mutant, TnT-mutant mouse hearts and human-HCM. (a,b) Volcano plots of normalized miRNA reads in hearts of (a) MyHC-mutant mouse hearts, (b) TnT-mutant mouse hearts and littermate-control hearts (ContM and ContT). Each dot represents individual miRNA. The values are means of three biological replicates. Significantly (adjusted p < 0.05) upregulated miRNAs (miR-99b-5p, miR-195a-5p, miR-497a-5p) are shown in magenta and significantly downregulated miRNA (miR-150-5p) is shown in cyan in (b). miRNAs with > 300 normalized reads in any of the genotypes are shown. (c,d) Volcano plot of log2(fold-change) of miRNA-seq results in (c) MyHC-mutants and (d) TnT-mutants compared to littermate-controls. Benjamini–Hochberg method was used to adjust p values for multiple comparisons (n = 3 biological replicates). (e,f) Heatmap of log2(fold-change) of normalized miRNA reads in MyHC-mutants and TnT-mutants compared with littermate-controls (means of three biological replicates are presented). miRNAs are sorted in descending order of fold-change in abundance in (e) MyHC-mutants and (f) TnT-mutants. (g) Normalized miRNA abundance of miR-150-5p, miR-99b-5p, miR-195a-5p, and miR-497a-5p (mean ± S.D. n = 3 biological replicates; *p < 0.05 using 2-sided unpaired Student’s t-test). (h) Volcano plots of normalized miRNA reads in human myectomy tissue and control-hearts. (i) Heatmap of log2(fold-change) of normalized miRNA reads in human myectomy tissue (n = 107) compared to control-hearts (n = 20). miRNAs are ordered in descending order of fold-change in abundance (means are presented). (j) Normalized miRNA abundance of miR-150-5p, miR-99b-5p and miR-195a-5p (mean ± S.D.; n = 107 HCM patients/n = 20 controls; *p < 0.05 using 2-sided unpaired Student’s t-test).

