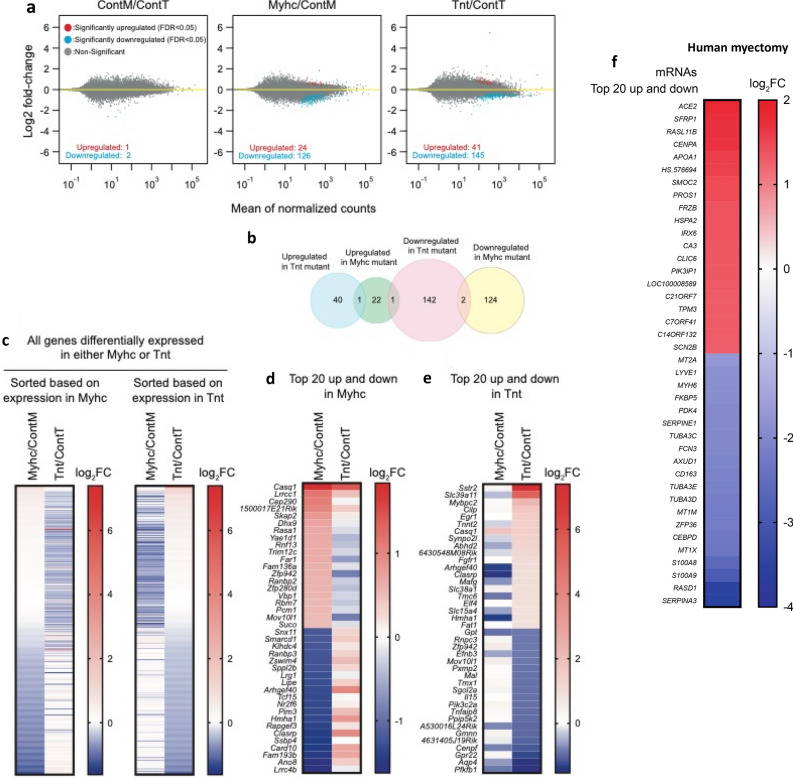
Figure 3.
Global mRNA-seq analysis of MyHC and TnT-mutant mouse hearts and human-HCM. (a) Volcano plots of mRNA expression. X-axis shows mean of normalized counts among the 6 biological samples tested (3 biological replicates each for two genotypes compared in each graph) and Y-axis shows log2(fold-change) in the normalized counts. (b) Venn diagram of the numbers of differentially expressed genes. (c) Heatmaps of log2(fold-change) of mRNA expression levels in MyHC-mutant and TnT-mutant mouse hearts compared with littermate-control hearts for the 150 and 186 genes that are differentially expressed (adjusted p < 0.05) in either MyHC or TnT-mutant mice, respectively (means of three biological replicates are presented). The genes are sorted based on log2(fold-change) in MyHC-mutant mice (left panel) or in TnT-mutant mice (right panel). (d) Heatmap of log2(fold-change) of top 20 upregulated genes and downregulated genes in MyHC-mutant mice compared to littermate-controls (means of three biological replicates are presented). (e) Heatmap of log2(fold-change) of top 20 upregulated and downregulated genes in TnT-mutant mice compared to littermate-controls (means of three biological replicates are presented). (f) Heatmap of log2(fold-change) of top 20 upregulated and downregulated genes in human myectomy tissue compared to control hearts (means data is presented; n = 105 HCM patients/n = 39 controls).

