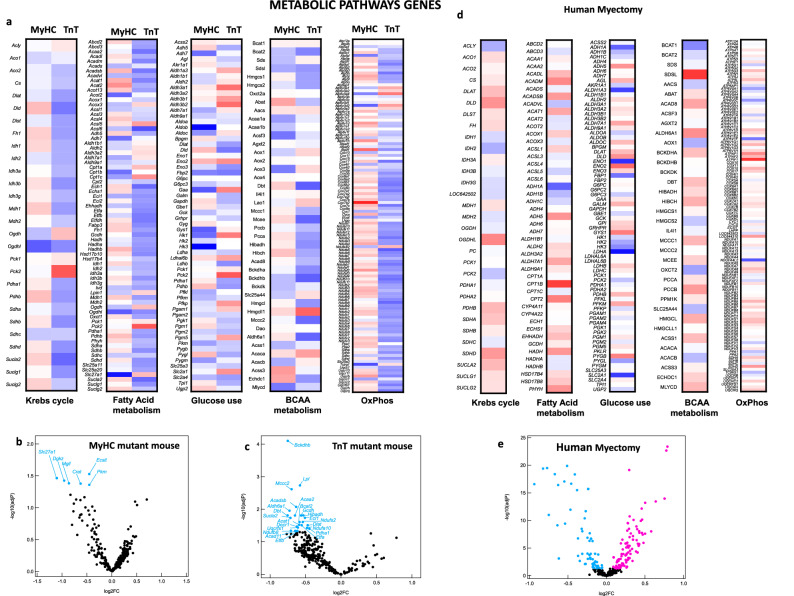
Figure 4.
Differential metabolic gene expression in MyHC and TnT-mutant mouse hearts and human-HCM. (a) Heatmap of log2(fold-change) of normalized mRNA reads in MyHC-mutant and TnT-mutant mouse hearts compared with littermate-control hearts. mRNAs are clustered depending on the metabolic function of the involved metabolic genes (Krebs cycle, Fatty Acid metabolism, Glucose use, BCAA, OxPhos). Means of three biological replicates are presented. (b,c,e) Volcano plots of normalized mRNA reads of metabolic genes in MyHC-mutant and TnT-mutant mice compared to littermate-controls and in human myectomy tissue and control-hearts. Benjamini–Hochberg method was used to adjust p values for multiple comparisons; n = 3 biological replicates. (d) Heatmap of log2(fold-change) of normalized mRNA reads in human myectomy tissue compared to control-hearts (means are presented; n = 105 HCM patients/n = 39 controls). mRNAs are clustered depending on the metabolic function of the involved metabolic genes (Krebs cycle, Fatty Acids, Glucose use, BCAA, OxPhos).

