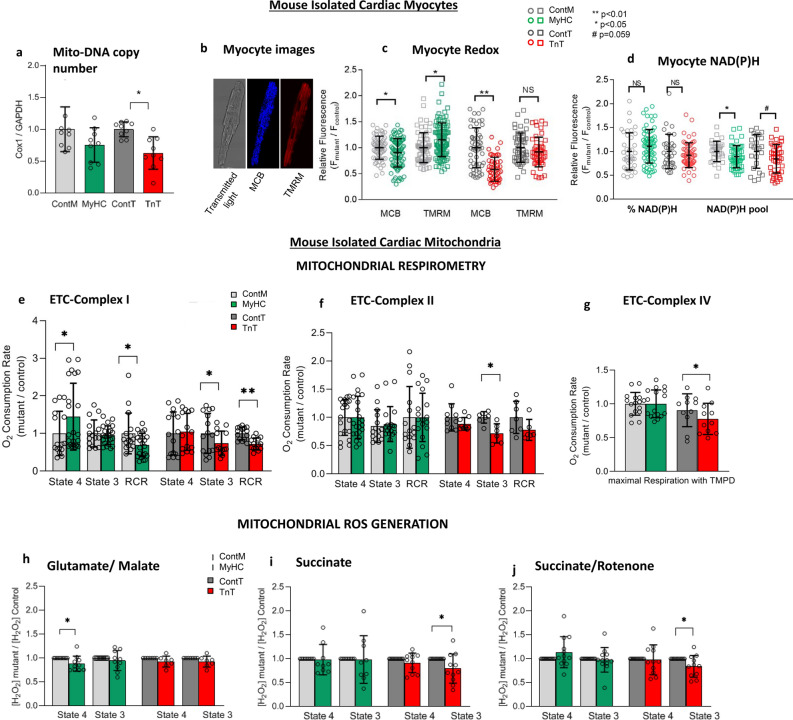
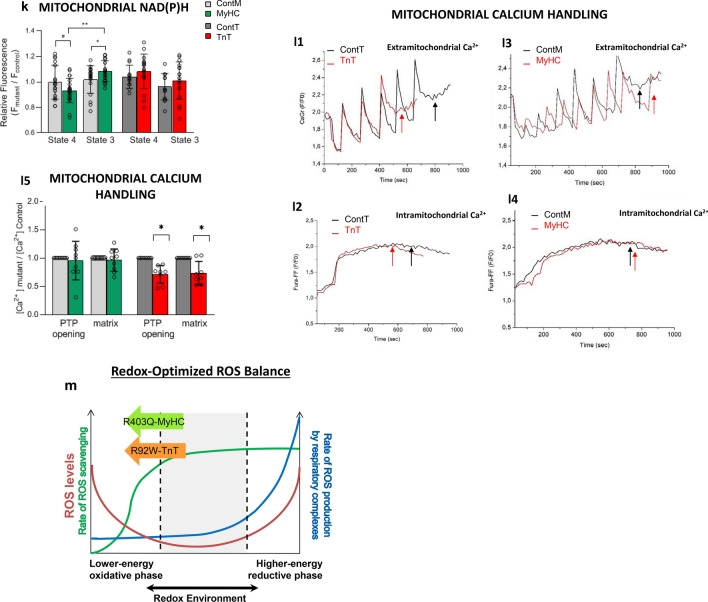
Figure 5.
Myocyte and mitochondrial studies in mutant and littermate control mouse hearts. (a) Mitochondrial DNA copy number (mtDNA-CN) is presented as relative copy number of COX/GAPDH. MtDNA-CN in mutants was normalized to littermate-control data. MyHC-mutants had similar mtDNA-CN, whereas TnT-mutants had lower mtDNA-CN when compared to littermate-controls (n = 9 hearts in each group; *p = 0.02 using 2-sided unpaired student’s t-test). (b–d) Two-photon microscopy: (b) Representative images of cardiac myocytes. From right to left, unstained myocyte (transmitted light) and stained with MCB (blue) and TMRM (red) to simultaneously monitor reduced glutathione (GSH) and mitochondrial membrane potential (Δψm) respectively. (c) Both mutant mouse myocytes had lower levels of GSH when compared to controls. ΔΨm was more hyperpolarized in MyHC-mutants, but similar in TnT-mutants, when compared to littermate-controls. (d) NAD(P)H levels were similar, but NAD(P)H pool levels were lower in both mutants when compared to littermate-controls (n = 3 mice in each group with ≥ 30 cells imaged per animal; *p < 0.05, **p < 0.01 using 2-sided unpaired student’s t-test. Fluorescence unit (FU) data is normalized to littermate-controls. %NAD(P)H was calculated based on NAD(P)H FU, normalized to respective NAD(P)H pool). (e–g) Mitochondrial respiration: (e) Complex I respiration: MyHC-mutant mitochondria had higher state 4 respiration, whereas TnT-mutants had lower state 3 respiration resulting in lower complex I respiratory control ratio (RCR) in both mutants when compared to littermate-controls. (f) Complex II respiration: Only TnT-mutants had lower state 3 respiration compared to littermate-controls. (g) Complex IV respiration: Only TnT-mutants exhibited lower complex IV respiration when compared to littermate-controls (n = 8 mice in ContM and TnT-mutants; n = 10 mice in ContT; n = 12 mice in MyHC-mutants; *p < 0.05, using 2-sided unpaired student’s t-test). (h–j) Mitochondrial H2O2 (ROS) generation: MyHC-mutant mitochondria demonstrated lower ROS during state 4 with glutamate/malate but similar ROS during State 3 as littermate-controls. MyHC-mutants showed similar ROS with succinate ± rotenone. TnT-mutants demonstrated lower ROS emission in state 3 with succinate ± rotenone (n = 8 mice for ContT and TnT-mutants; n = 10 mice for ContM and MyHC-mutants; *p < 0.05, using 2-sided one sample t-test). (k) Mitochondrial NAD(P)H: MyHC-mutant mitochondria had lower levels of reduced NAD(P)H during state 4, but higher levels during state 3 compared to littermate-controls; TnT-mutants had similar reduced NAD(P)H in state 3/4 as littermate-controls (n = 10 mice for ContT; n = 12 mice for ContM and TnT-mutants; n = 14 mice for MyHC-mutants. *p < 0.05, **p < 0.01 using 2-sided unpaired student’s t-test). (l) Mitochondrial Ca2+ handling: Mitochondria were pre-incubated with Fura-FF (20 μΜ) to monitor [Ca2+] changes in the mitochondrial matrix. Calcium Green-5N (0.1 μM) was added at the beginning of the experiment to monitor extra-mitochondrial [Ca2+] changes. Mitochondria were energized with glutamate/malate (GM) and additions of CaCl2 followed until the opening of PTP occurred (reflected by abrupt slow increase in the extra-mitochondrial calcium signal and slow decrease in the intra-mitochondrial calcium signal. Traces of extramitochondrial (l1, l3) and intramitochondrial (l2, l4) calcium signal in mutant TnT or MyHC (red trace) and littermate control (black trace) mitochondria. l5. Bar graphs summarizing mitochondrial Ca2+ handling Mitochondrial permeability transition pore (mPTP) activation occurred at similar [Ca2+] as littermate-controls in MyHC-mutants, but at lower [Ca2+] than littermate-controls in TnT-mutants. When compared to littermate-controls, matrix [Ca2+]free was similar in MyHC-mutants and lower in TnT-mutants (n = 10 mice for MyHC-mutants/controls; n = 8 mice for TnT-mutants/controls; *p < 0.05, using 2-sided one sample t-test). *(a–l): all comparisons were made for each group (ContM vs MyHC and ContT vs TnT). (m) Redox-optimized ROS balance: Both mutant mouse hearts are characterized by a lower-energy oxidized redox environment, due to lower reduced GSH and NAD(P)H pool levels, despite lack of increase in mitochondrial ROS generation.


