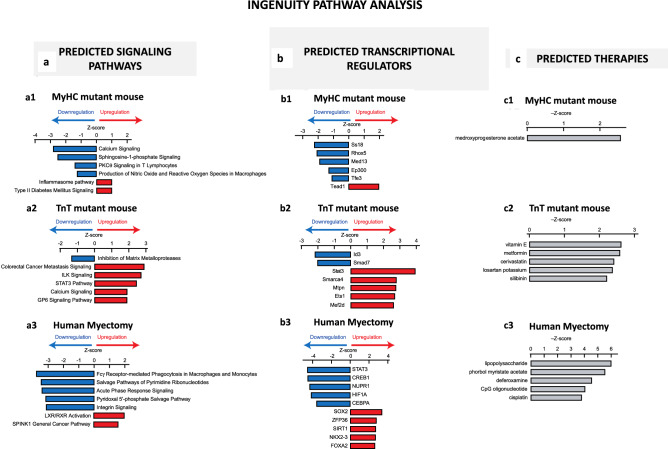
Figure 6.
Ingenuity pathway analysis: top 5 dysregulated signaling pathways (a), transcriptional factors (b) and therapies (c) are presented for MyHC-mutant (1) TnT-mutant (2) mouse hearts, and human myectomy tissue (3). All comparisons are made to corresponding controls. Cutoff value for significance of p < 0.01 and |Z-score|> 1. Comparison of mRNA data from mutant HCM mice and human myectomy samples with respective controls was performed by ANOVA using the Partek Genomics Suite 7.0 platform.

