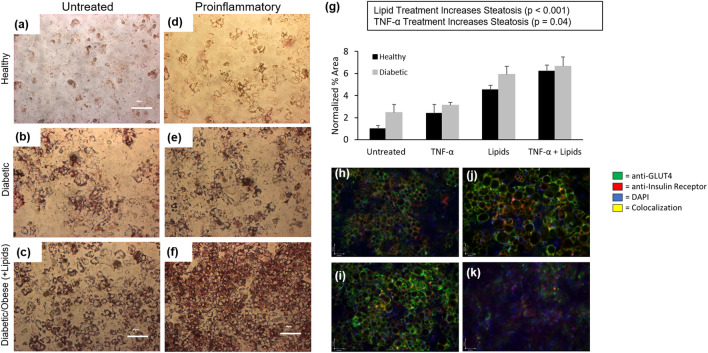
Figure 4.
Expression of NAFLD phenotype in 2-chamber systems. Oil Red O staining showing lipid accumulation in hepatocytes after 14 days in recirculating 2-chamber systems containing (a) Healthy BMM (b) Diabetic BMM (c) Diabetic + obese BMM (d) Proinflammatory BMM (e) Diabetic + proinflammatory BMM (f) Diabetic, obese + proinflammatory BMM). (g) Quantification of hepatocyte lipid accumulation. ICC quantification of insulin resistance biomarkers after 14d in recirculating (h) Healthy BMM (i) Diabetic BMM (j) Diabetic + Obese BMM (k) Diabetic, obese, and proinflammatory BMM. Statistical analysis performed as multi-way ANOVA followed by Dunnett’s test (α = 0.05) using the coverslip-wide average of two independent coverslips per condition.

