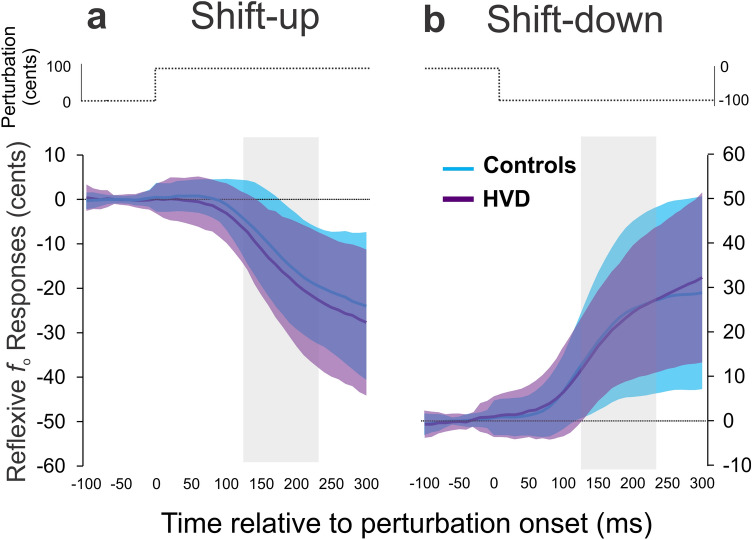
Figure 2.
Reflexive responses. Average reflexive responses to voice fundamental frequency (fo) in cents are shown for the control group (light blue line) and hyperfunctional voice disorder (HVD) group (dark purple line) for the shift-up (panel a) and shift-down (panel b) conditions. The shaded regions in each panel indicates the group means + / − standard deviation for both the control group (light blue shading) and HVD group (dark purple shading). The grey highlighted columns show the time interval used for analysis.

