Figure 3.
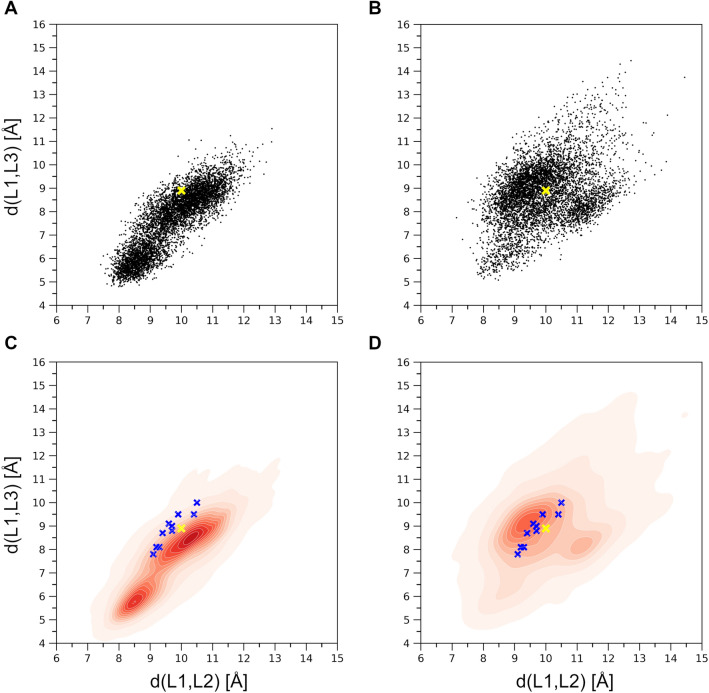
(A) Distribution of the d(L1,L2) and d(L1,L3) distances corresponding to the MD generated conformations; (B) Distribution corresponding to the MDeNM generated conformations; (C) Corresponding normalized distribution densities for the MD conformations and (D). for the MDeNM conformations. The available crystal structures (denoted by blue ‘x’-es) are plotted into the maps of (C, D); The location of the crystal structure (4GRA.pdb) is shown in yellow ‘x’.

