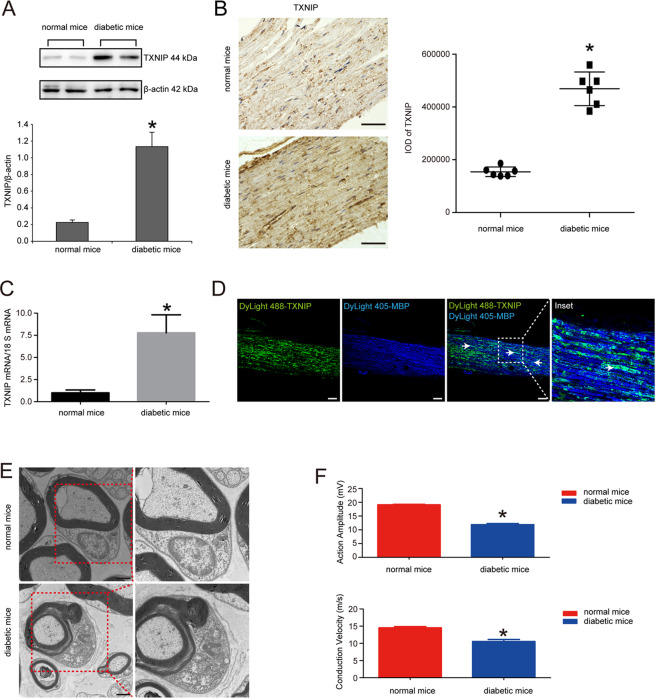
Fig. 1. TXNIP expression was increased in the sciatic nerves of diabetic mice.
A Western blot and statistical analysis of TXNIP expression in the sciatic nerves of normal mice and diabetic mice. *P < 0.05 versus normal mice. B Immunohistochemistry of TXNIP expression in the sciatic nerves of normal mice and diabetic mice and the statistical analysis of integrated optical density (IOD) of positive staining. *P < 0.05 versus normal mice. Bar: 50 μm. C Real-time PCR of TXNIP mRNA expression in the sciatic nerves of normal mice and diabetic mice. *P < 0.05 versus normal mice. D Double staining immunofluorescence of TXNIP (indicated in green) and MBP (indicated in blue) in the sciatic nerves of diabetic mice. White arrows showed the co-localization region. The inset was shown with dashed square. Bar: 50 μm. E Electron microscope observation of myelin sheath structure in the sciatic nerves of normal mice and diabetic mice. Bar: 1000 nm. F Electrophysiological detection of action amplitude and conduction velocity of the sciatic nerves of normal mice and diabetic mice. *P < 0.05 versus normal mice.

