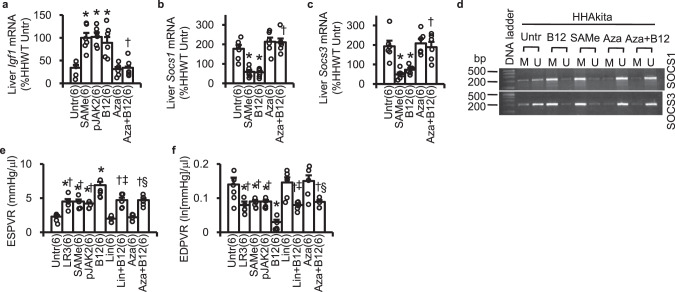
Fig. 7. DNMTs-SOCS1/3-IGF-1 pathway on the cardioprotective effects of B12.
a Liver Igf1 mRNA, b Liver Socs1 mRNA, and c Liver Socs3 mRNA of Elmo1H/H Ins2Akita/+ mice treated for 16 weeks with S-adenosylmethionine (SAMe; 200 mg/kg/day PO), a SOCS1/3 inhibitor pJAK2(1001–1013) (pJAK2; 50 mg/kg/day IP), B12 alone, and a DNMT inhibitor 5-aza-2’-deoxycytidine (Aza; 10 mg/kg/day IP) with or without B12 compared with those for untreated (Untr) or and treated mice with B12 only (the same as those in Figs. 5 and 6). mRNA levels normalized by β-actin mRNA are expressed relative to the mean levels in HHWT mice as 100%. *P < 0.05 vs. Untr; †P < 0.05 vs. B12 only. d PCR products amplified with methylation (M) and unmethylation (U)-specific primers for the promoters of SOCS1 and SOCS3 using 50 ng of bisulfite-treated liver DNA. The first lane of the panels shows DNA size markers. e End-systolic pressure–volume relationship (ESPVR) determined by pressure–volume loop analysis and f End-diastolic pressure–volume relationship (EDPVR) of the Elmo1H/H Ins2Akita/+ mice assessed after 8 weeks of treatments with a long-acting IGF-1 analog IGF-1 Long R3 (LR3; 1 mg/kg/day IP), SAMe, pJAK2, and an IGF-1 receptor inhibitor linsitinib (Lin; 50 mg/kg/day PO) and Aza with and without B12. Data are expressed as means ± standard errors. *P < 0.05 vs. Untr; †P < 0.05 vs. B12; ‡P < 0.05 vs. Lin; §P < 0.05 vs. Aza; by Tukey–Kramer Honestly Significant Differences test.

