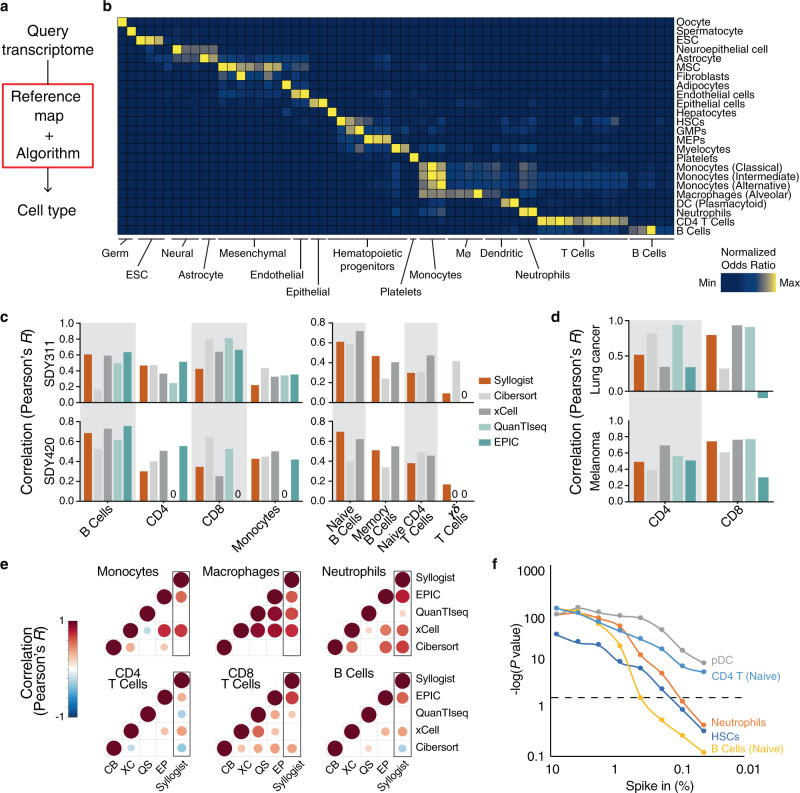
Fig. 1. Cell type estimation using transcriptomes.
a Simplified workflow of Syllogist for detection and relative quantitation of cell types from bulk tissue transcriptomes. b Heat map comparing the number of genes enriched for each published positive control sample (rows) and cell type (columns) over random enrichment. Each colored box represents a normalized odds ratio of the respective Fisher’s exact test ranging from 0 (blue) to 1 (yellow). ESC Embryonic stem cell, MSC Mesenchymal stem cell, HSCs Hematopoietic stem cells, GMPs Granulocyte–monocyte progenitors, MEPs Megakaryocyte–erythroid progenitors, DC Dendritic cell. c Comparison of Syllogist with CIBERSORT, xCell, QuanTIseq and EPlC. Bar plots represent the Pearson correlation coefficients calculated by comparing the Syllogist odds ratios, the CIBERSORT, xCell, QuanTIseq, and EPlC scores with the quantitative data of PBMC fractions measured by CyTOF (SDY311 [https://www.immport.org/shared/study/SDY311], n = 61 patients and SDY420 [https://www.immport.org/shared/study/SDY420], n = 104)19. d same as (c), applying melanoma (n = 32 samples) and lung cancer (n = 8) datasets with paired quantitative data of CD4 and CD8 T cells by immunofluorescence22. e Correlation matrices represent the agreement of Syllogist with four established computational methods for the indicated immune cell types. Pearson correlation coefficients with p < 0.05 are shown as circles, with circle size and color matching Pearson correlation coefficients from −1 (blue) to 1 (dark red). Empty squares represent correlation coefficients of p ≥ 0.05). CB Cibersort; QS QuanTIseq, XC xCell, EP EPIC. p values determined using a two-tailed Student’s t-test. f Line chart represents −log10 (p values) obtained by comparing paired samples with and without spike-in for the indicated cell types at various percent spike-in (n = 200 brain tissue transcriptomes, two-tailed paired Student’s t-test). pDC plasmacytoid dendritic cells, HSCs Hematopoietic stem cells. The horizontal dashed line indicates the threshold considered for significance (p = 0.05). Source data of (c), (d) and (f) are provided as a Source Data file.

