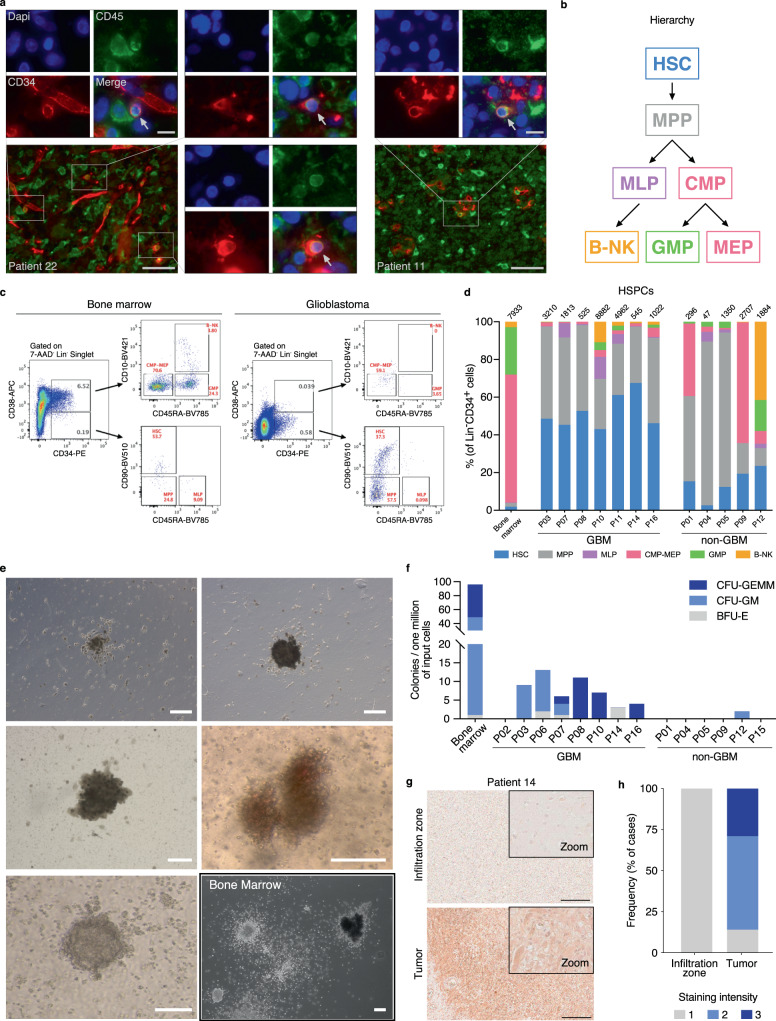
Fig. 3. Characterization of tumor-associated HSPCs in human glioblastoma tissues.
a Representative immunofluorescence appearance of CD34+ (red)/CD45+ (green) cells (arrows) in formalin-fixed, paraffin-embedded glioblastoma tissue sections from two patients (out of four analyzed, all with similar results). Nuclei were counterstained with DAPI (blue). Scale bars = 50 µm (overview) and 10 µm (insets). b Diagram describes the hierarchy of HSPC subsets analyzed in this study by flow cytometry. HSC Hematopoietic stem cell, MPP Multipotent progenitor, MLP Multi-lymphoid progenitor, CMP–MEP Common myeloid progenitor and megakaryocyte-erythroid progenitor, GMP Granulocyte–Monocyte Progenitor, B-NK B-NK progenitor. c Representative flow cytometry profiles of human bone marrow and glioblastoma tissue, gated for seven HSPC subsets. Cellular frequencies are highlighted in red. d Stacked barplot of seven HSPC subsets observed in glioblastoma (GBM, n = 7), non-glioblastoma tumor tissues (non-GBM, n = 5, Supplementary Data 4) and a healthy donor bone marrow sample by flow cytometry. e Representative colony morphologies from CFC assays of glioblastoma cell suspensions derived from a total of eight patients, and from bone marrow-derived mononuclear cells. Scale bars = 100 µm. f Barplot indicating number and types of colonies in CFC assays derived from bone marrow, glioblastoma (GBM, n = 8 patients) and non-glioblastoma (non-GBM, n = 6 patients) cell suspensions. CFU Colony forming unit, -GEMM Granulocyte, erythrocyte, monocyte, megakaryocyte, -GM, Granulocyte, monocyte, -E, Erythroid. g CXCL12 staining of the infiltration zone (upper panel) and the tumor (lower panel) of the same tissue section. Scale bars = 200 µm. One representative staining of eight shown). h Barplot showing percent CXCL12 staining intensity (1 = weakly positive, 2 = moderately positive, 3 = strongly positive) of tumor core and infiltration zones from glioblastoma (n = 16 samples from eight patients). Source data of (a), (d), (f), (g), and (h) are provided as a Source Data file.

