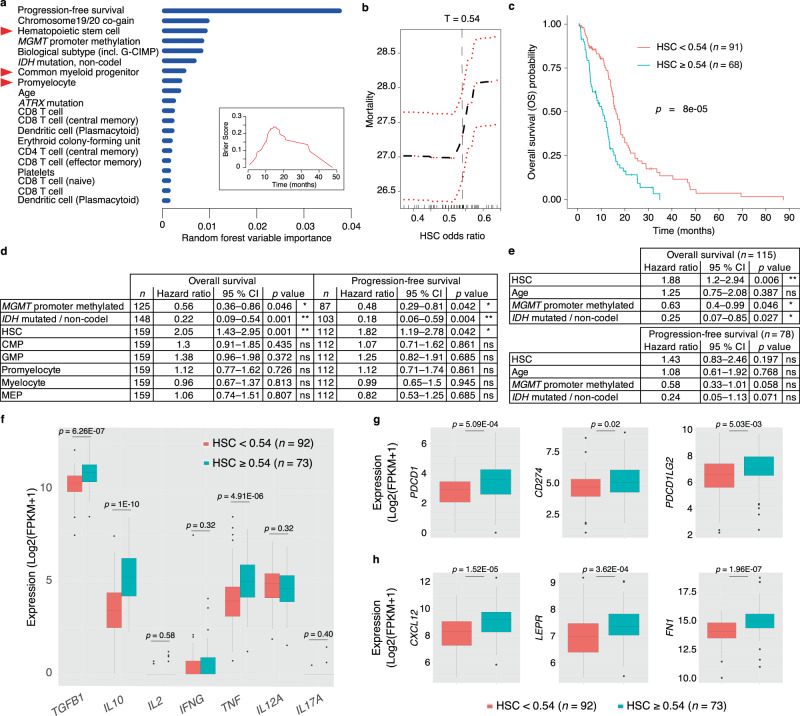
Fig. 6. HSPCs predict clinical outcomes in glioblastoma and associate with an immunosuppressive phenotype and stem cell niche factors.
a Bar plot representing the top 20 predictors of glioblastoma overall survival in decreasing order of importance computed by the random forest classifier. Red triangles highlight HSPC subsets. Inset, Brier score indicates error rate of random forest classifier results as function of survival time (Brier score 0 = 0 % error, 1 = 100% error). MGMT O(6)-Methylguanine-DNA methyltransferase, G-CIMP Glioma CpG island methylator phenotype, IDH Isocitrate dehydrogenase. Source data are provided as a Source Data file. b Mortality rate as a function of hematopoietic stem cell (HSC) odds ratios derived by Syllogist and used to determine threshold separating HSChigh (n = 63) and HSClow (n = 76) patients. Red lines represent 95% CI. c Kaplan–Meier plot of HSChigh and HSClow patients using the threshold T = 0.54 selected from (b). Two-tailed logrank test. d Univariate Cox regression analysis of selected variables for overall survival and progression-free survival data. e Multivariable Cox proportional hazards model of the HSC subset and potential confounders (Age, MGMT methylation, and IDH mutations) for overall and progression-free survival. In (d) and (e), we used a two-tailed likelihood-ratio test corrected by the Benjamini–Hochberg procedure. All variables satisfied the proportionality hazards assumption (Methods). CMP Common myeloid progenitor, GMP Granulocyte–Monocyte progenitor, MEP Megakaryocyte–Erythroid progenitor. f Boxplots represent the expression of pro- and anti-inflammatory cytokines in HSChigh (n = 73) and HSClow (n = 92) patient samples. TGFB1 Transforming growth factor beta 1, IL10, IL2 Interleukin 10 and 2, INFG Interferon gamma, TNF Tumor necrosis factor, IL12A Interleukin 12 subunit alpha, IL17A Interleukin 17A. g Boxplots represent the expression of the immune checkpoint markers PD-1 (PDCD1), PD-L1 (CD274), and PD-L2 (PDCD1LG2) in HSChigh and HSClow samples. h Boxplots represent the expression of hematopoietic stem cell niche factors C-X-C motif chemokine 12 (CXCL12), leptin receptor (LEPR), and fibronectin (FN1) in HSChigh and HSClow samples. In (f–h), boxplots are drawn with boxes representing the interquartile range (IQR), a line across the box indicating the median, and whiskers indicating 1.5 × IQR. Outliers are shown as closed dots. p values determined using a two-tailed Wilcoxon–Mann–Whitney U test corrected with the Benjamini–Hochberg procedure.

