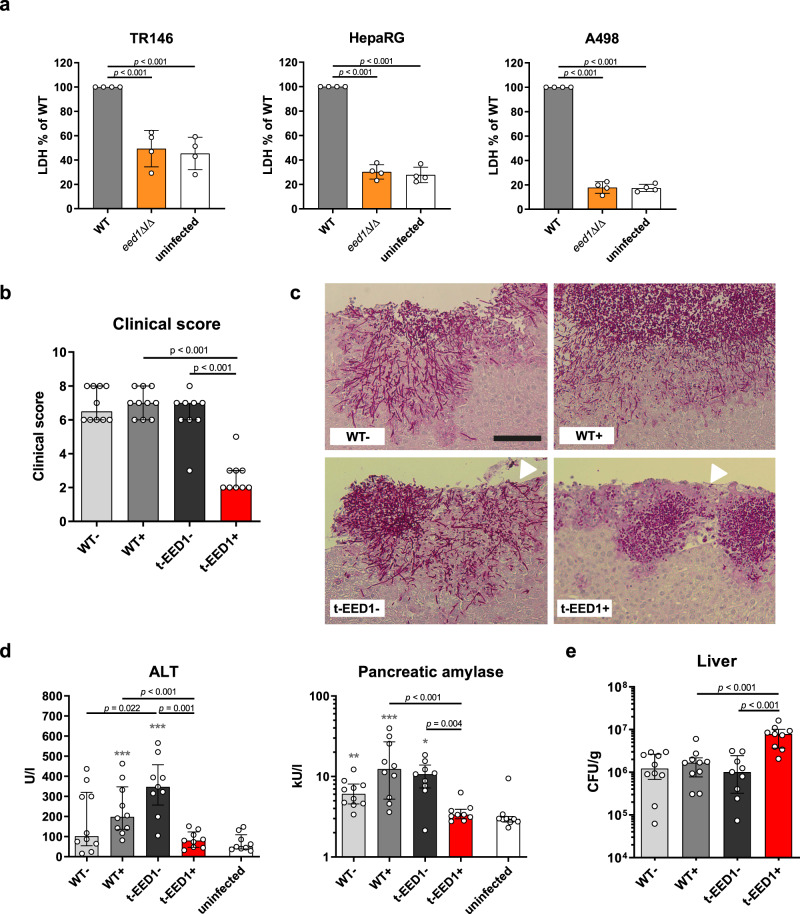
Fig. 1. Hyphal elongation of C. albicans is required for tissue damage in vitro and virulence in an intraperitoneal infection model.
a Damage of oral (TR146), hepatic (HepaRG) and renal (A498) epithelial cells was quantified by measuring the release of lactate dehydrogenase (LDH) into the supernatant after co-incubation for 24 h with WT (SC5314) or eed1Δ/Δ mutant. Uninfected cells served as negative control. LDH released by WT was set to 100%. Data are presented as mean ± SD from four biologically independent experiments. Within each experiment, supernatants from three wells infected by the same strain were pooled and LDH was measured. Data was analyzed by two-tailed students t-test. b–e t-EED1 + yeasts are attenuated in invasion, damage and virulence potential despite higher organ fungal loads in the intraperitoneal infection model 24 h post infection. Mice were infected intraperitoneally with 1 × 10⁸ cells of WT (THE1-CIp10) or t-EED1 in the presence (+) or absence (−) of doxycycline supplied via the drinking water. Data derived from two independent experiments, WT− and WT+ n = 10, t-EED1− and t-EED1+ n = 9 animals per group. b Repression of EED1 by doxycycline led to significantly reduced clinical symptoms in mice. The semiquantitative clinical score was determined by assessing fur, coat and posture, behavior and lethargy, fibrin exudation and other symptoms like diarrhea. The score ranges from 0 (no symptoms) to 10 (severe illness). c Representative images of periodic acid-Schiff stained histological sections of liver tissue 24 h p.i., fungal cells are stained purple. Arrows point towards the liver surface (capsule, partially destroyed). The scale bar represents 100 µm and applies to all images. d Damage of liver and pancreas was quantified by measuring serum levels of alanine aminotransaminase (ALT) and pancreatic amylase, respectively. Enzyme levels of uninfected mice (n = 9) served as negative control. e Fungal burden in the liver. b, d, e Median and interquartile range are shown, two-sided Mann–Whitney test. Asterisks above bars represent significant differences compared to the uninfected control *p ≤ 0.05; **p ≤ 0.01; ***p ≤ 0.001. Source data are provided as a Source Data file.

