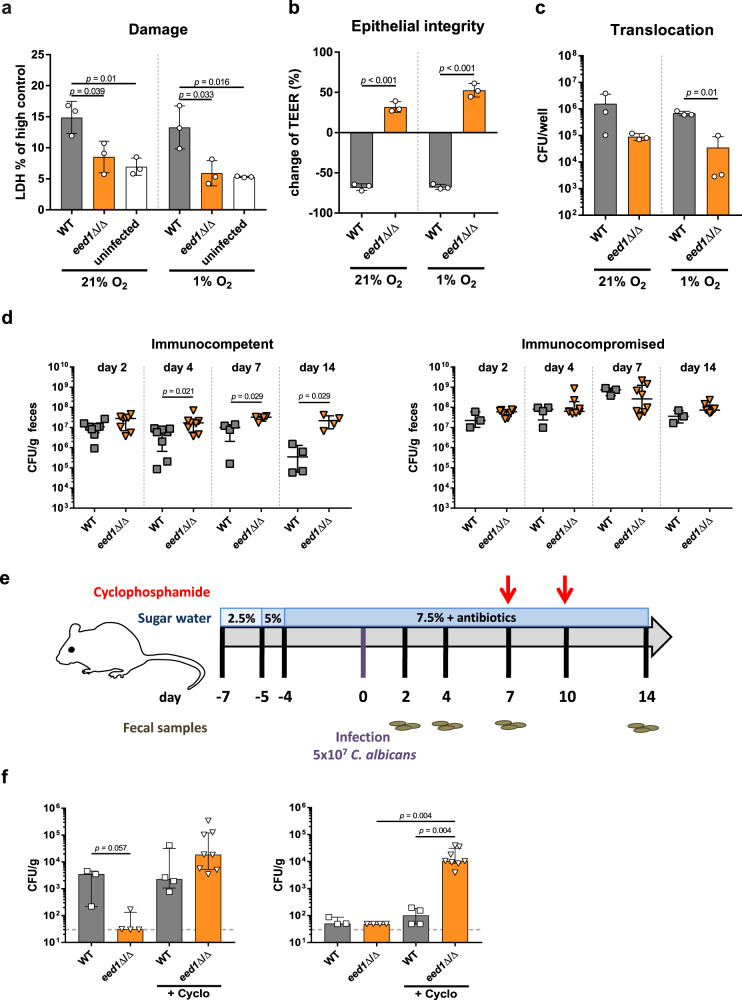
Fig. 2. The eed1Δ/Δ mutant shows a reduced translocation capacity in vitro and in a gut dissemination model in immunocompetent but not in immunocompromised mice.
a–c C2BBe1 cells were infected with C. albicans WT (SC5314) or the eed1Δ/Δ mutant and incubated under normoxic (21% O2) or hypoxic (1% O2) conditions for 24 h. a Damage of C2BBe1 cells was quantified by measurement of LDH and is shown in % of high control (cells lysed with Triton X-100). Uninfected cells served as negative control. b Integrity of epithelial barrier was quantified by TEER measurement. Data are expressed as change of TEER 24 h post infection compared to TEER values prior to infection in percent. c Translocation across the epithelial barrier was assessed by CFU plating. a–c Graphs show the mean ± SD of three independent biological replicates, two-tailed students t-test. p-values are shown in the graph. d Fungal burden in feces of antibiotic-treated immunocompetent and mice rendered immunocompromised by cyclophosphamide treatment. Immunocompetent, day 2 and 4 n = 8; day 7 and 14 n = 4 mice per group, one experiment. Immunocompromised WT infected n = 3; eed1Δ/Δ n = 8, one experiment. e Schematic overview of the timeline for the gastrointestinal dissemination model. f Fungal burden in liver (left) and kidneys (right) of immunocompetent or cyclophosphamide-treated immunosuppressed (+Cyclo) mice colonized with either C. albicans WT or eed1Δ/Δ mutant 14 d post infection. WT n = 3, one experiment; WT + Cyclo and eed1Δ/Δ n = 4, one experiment; eed1Δ/Δ + Cyclo n = 8 mice, data from two independent experiments. Dashed lines indicate limit of detection. d, f Shown is the median with interquartile range, two-sided Mann–Whitney test, p-values are shown in the graph. Source data are provided as a Source Data file.

