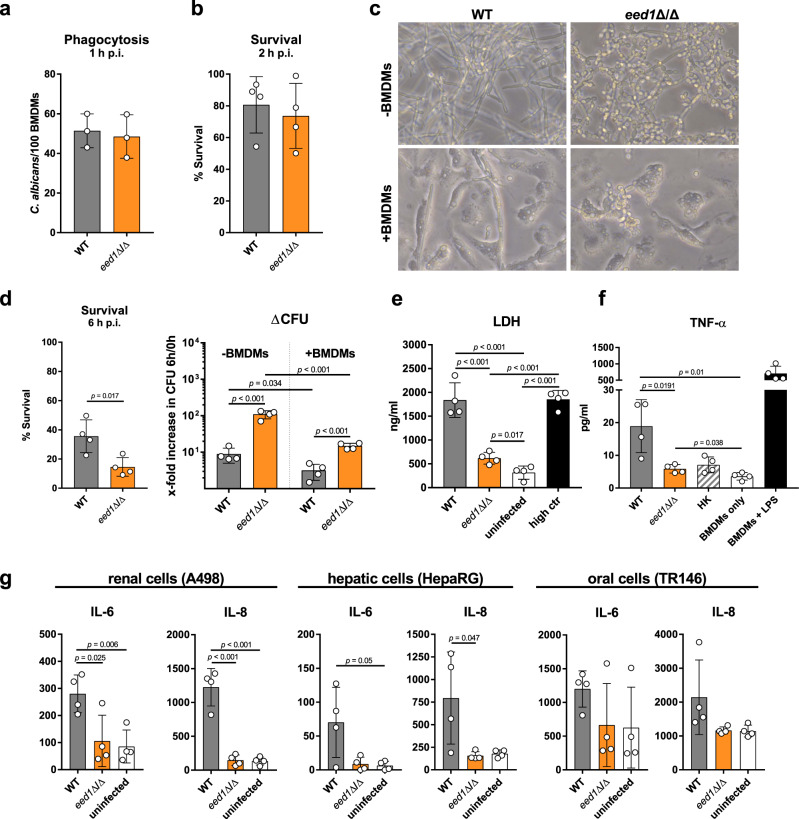
Fig. 5. eed1Δ/Δ yeast are less efficient in damaging and inducing cytokine responses of bone marrow-derived macrophages (BMDMs) and epithelial cells.
Murine bone marrow-derived macrophages (BMDMs) were infected at an MOI of 1 with C. albicans WT (SC5314) or eed1Δ/Δ mutant and incubated at 37 °C and 5% CO2. a Phagocytosis calculated as phagocytic index (the number of C. albicans cells phagocytosed by 100 BMDMs within 1 h of incubation). Mean ±SD from three biologically independent experiments. b Fungal survival was analyzed after co-incubation with BMDMs for 2 h by CFU plating. Survival was normalized to C. albicans controls incubated in the absence of immune cells. c Fungal morphology of WT and eed1Δ/Δ mutant in the absence (−) or presence (+) of BMDMs after 6 h of incubation. Scale bar represents 20 µm and applies to all images. d Fungal survival was analyzed after co-incubation with BMDMs for 6 h by CFU plating. Left: Survival was normalized to C. albicans controls incubated in the absence of immune cells. Right: To account for the observation that the mutant replicates faster than the WT in the absence of macrophages, data is shown as fold increase in CFU from 0 h to 6 h with and without BMDMs. e Damage of BMDMs was quantified by measuring lactate dehydrogenase (LDH) release into the supernatant after 24 h of co-incubation with C. albicans WT or eed1Δ/Δ mutant. Uninfected cells served as negative control and Triton X-100 lysed cells served as high control. f TNF-α release of BMDMs 24 h after co-incubation with C. albicans WT (SC5314), eed1Δ/Δ mutant or heat-killed (HK) WT cells. BMDMs were left untreated (BMDM only) or stimulated with 100 ng/ml LPS as positive control. g Release of IL-6 and IL-8 by renal (A498), hepatic (HepaRG) and oral (TR146) epithelial cells 24 h after infection with C. albicans. Uninfected cells served as negative control. b, d, e, f, g Mean ±SD of four biologically independent experiments are shown. b, d In each experiment, three wells were infected with each strain and fungal survival was quantified per well. The mean of these three samples is shown as single point for the individual experiment. Data were analyzed by two-tailed student’s t-test. p-values are shown in the graph. Source data are provided as a Source Data file.

