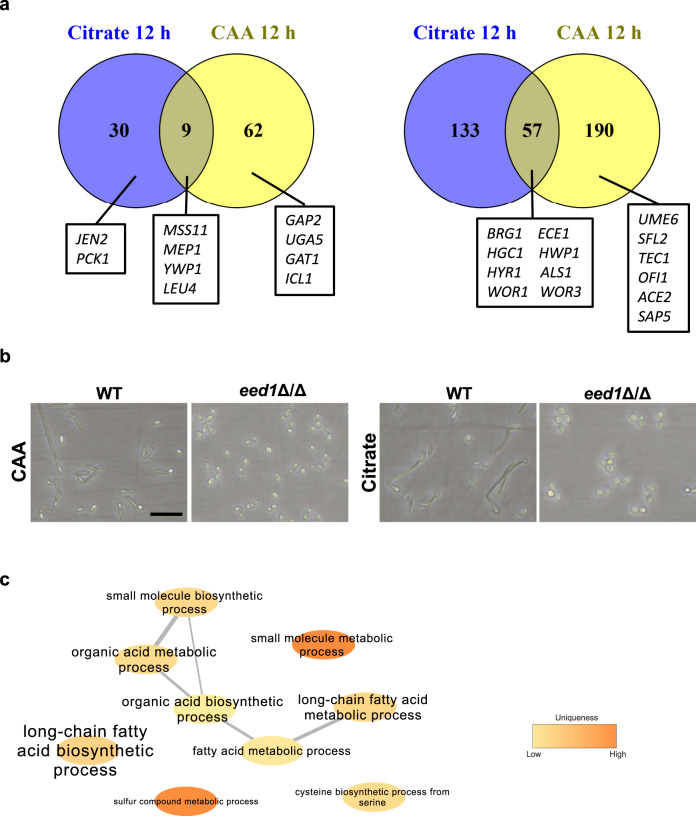
Fig. 7. Transcriptional analysis of the eed1Δ/Δ mutant during growth on citrate or casamino acids (CAA) after 12 h at 37 °C.
a Venn diagrams showing the numbers of genes significantly up- or down-regulated (±log2 2 and adjusted p-value <0.05) in the eed1Δ/Δ mutant compared to WT (SC5314) with citrate or CAA as sole carbon source. Genes referred to in the text are highlighted. b Morphology of C. albicans WT and eed1Δ/Δ mutant after 12 h of growth on citrate or CAA. Representative pictures from three biologically independent experiments are shown. Scale bar represents 20 µm and applies to all images. c Network analysis of Gene Ontology (GO) term enrichments of significantly up-regulated genes (+ log2 2 and adjusted p-value <0.05) in eed1Δ/Δ mutant compared to WT after 12 h of growth on citrate. Font size represents the p-value (p < 0.1) of the GO term: big letters – small p value, ranging from p < 2.3 × 10⁻⁵ to low p-value p < 0.09 indicated by small letters. Color is representing the uniqueness, indicating how particular each term is with respect to the set of terms being evaluated (original data analyzed are available in Supplementary Data 1).

